Menu
Refer a Friend
Share your link — earn +15 permanent plots for every friend who joins.
Sign in to get your referral linkmatplotlibmap
Map of CO2 emissions in 2023 by region and continent using geopandas
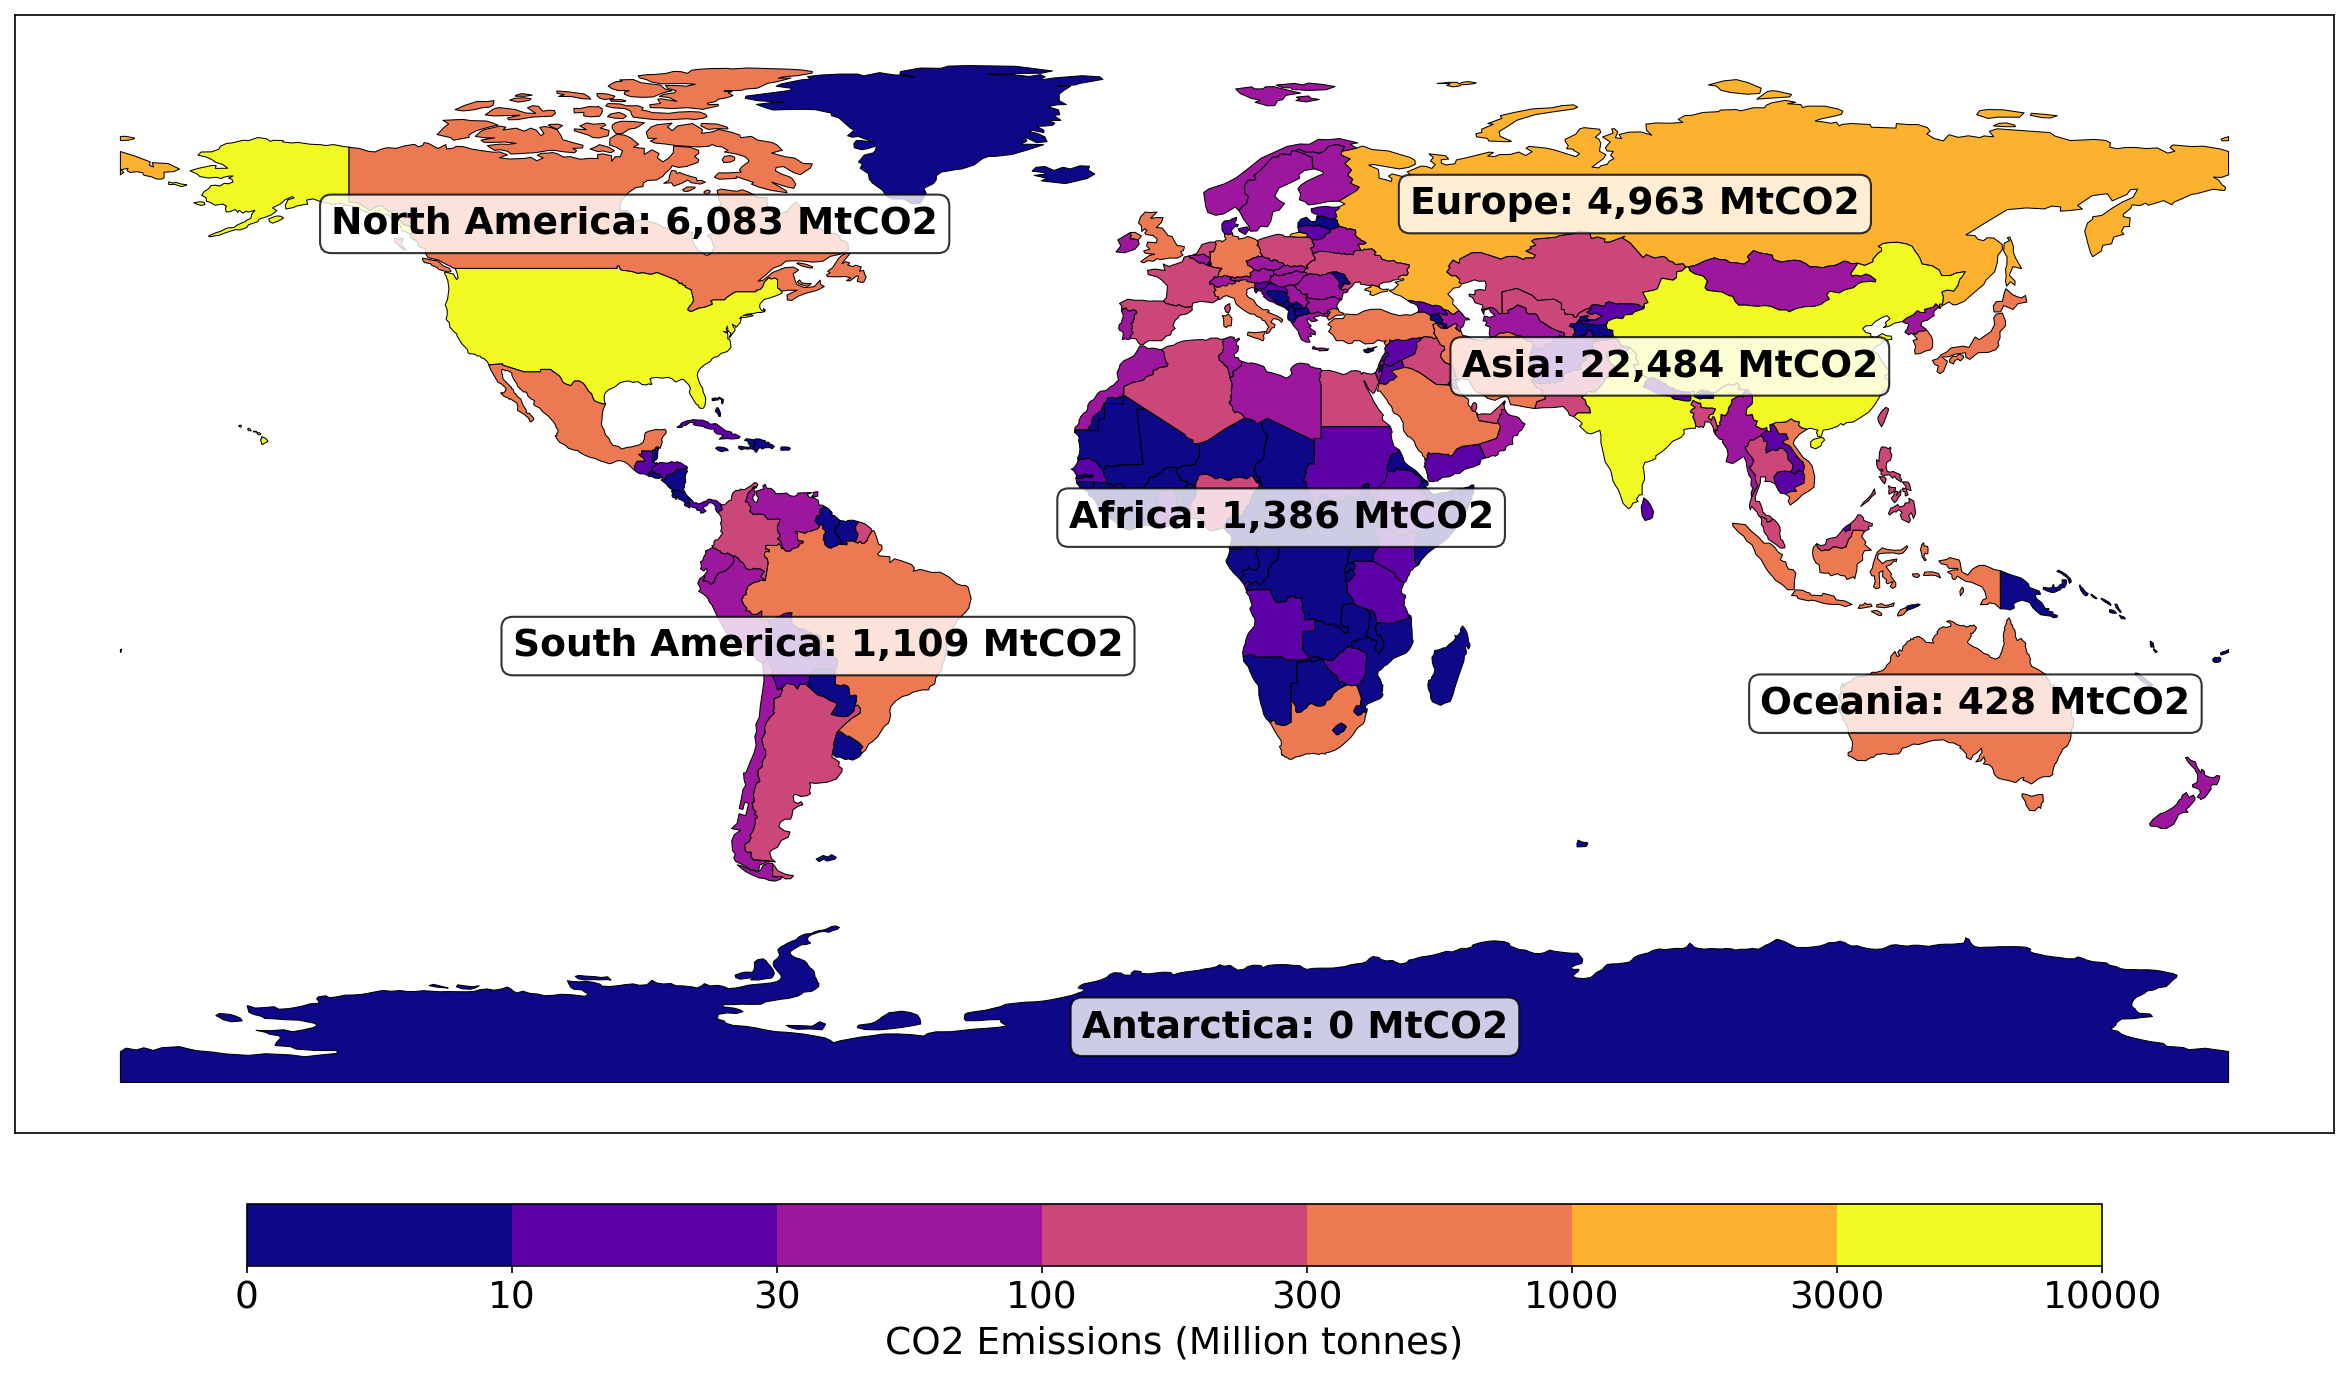
Description
Data source: https://ourworldindata.org/co2-and-greenhouse-gas-emissions Check this guide to reproduce it: https://scribehow.com/viewer/Plotivy_Step-by-Step_Guide_to_CO2_Map_Plot_Generation_using_Our_World_in_Data__AiUIXrdkQIm4Hp8CC80xkw
0
Creator
anonymous
Published
October 19, 2025
More sharing options