Popular Python technique guides
Start with the most requested analysis workflows from spectroscopy, statistics, and clinical research.
scipy.signal.find_peaks guide
Prominence, distance, and width parameters with practical peak detection examples.
Savitzky-Golay smoothing and savgol_filter
Window size tuning and how to fix window_length must be odd errors.
Mann-Whitney U test in Python
Nonparametric two-group comparison with scipy.stats.mannwhitneyu and effect size.
Kaplan-Meier survival curves
lifelines tutorial with confidence intervals and log-rank comparisons.
Technique selection
Choose the right Python analysis technique
Start from the scientific question, then choose the method. A curve-fitting guide is useful when you need model parameters, a statistics guide is useful when you need a defensible comparison, and a spectroscopy guide is useful when raw instrument signals need preprocessing before plotting.
Curve fitting and model comparison
Use when your result depends on estimating parameters from experimental data.
Linear regression, Gaussian fitting, Lorentzian fitting, exponential decay
Statistical testing and uncertainty
Use when the figure needs p-values, confidence intervals, or group comparisons.
T-test, ANOVA, Mann-Whitney, ROC curves, Kaplan-Meier
Signal processing and spectroscopy
Use when raw instrument output needs smoothing, baseline correction, or peak fitting.
Peak detection, Savitzky-Golay smoothing, PCA, calibration curves
Browse by Research Area
Jump directly to the collection most relevant to your field and instrument.
For Biologists
T-tests, curve fitting, enzyme kinetics, and omics data visualization.
For Spectroscopists
Peak fitting, baseline correction, and spectral analysis for Raman, FTIR, and UV-Vis.
Statistical Methods
Hypothesis tests, p-value annotation, PCA, and ROC analysis with matplotlib.
Curve Fitting
From linear regression to nonlinear models using scipy.optimize.curve_fit.
All Techniques
24 guides, each with complete Python code, a live code editor, and a publication-ready figure.

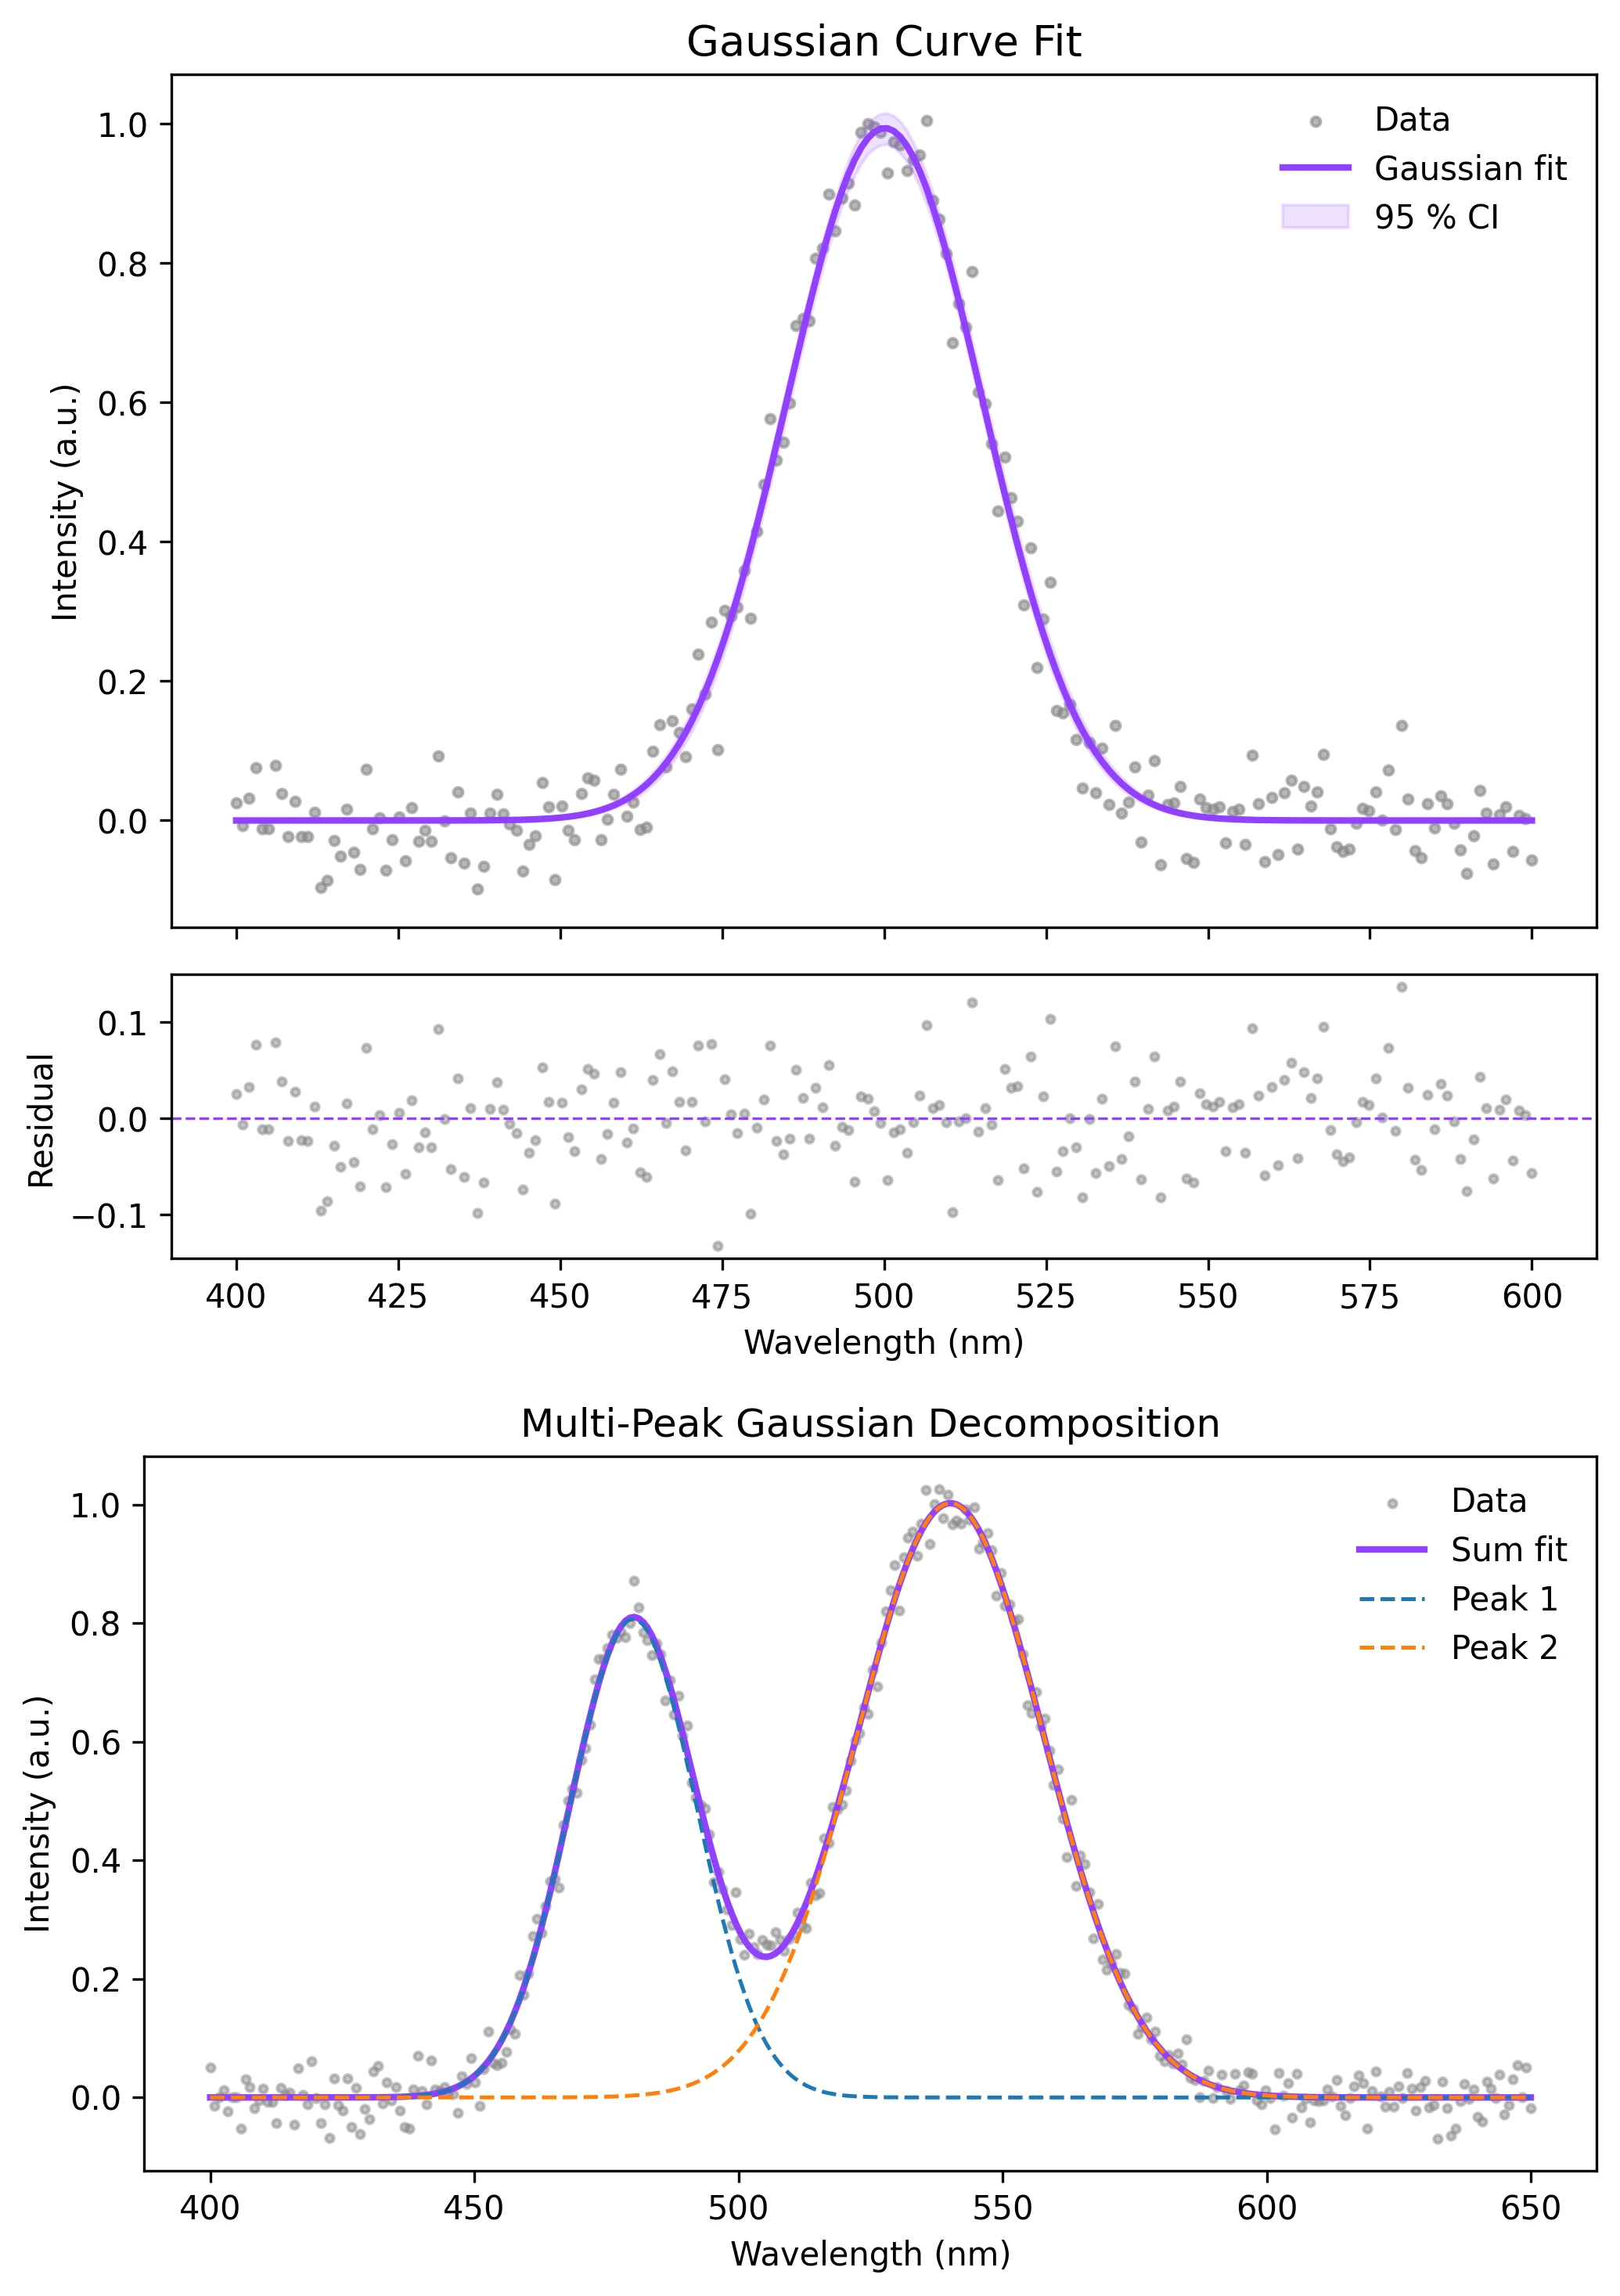
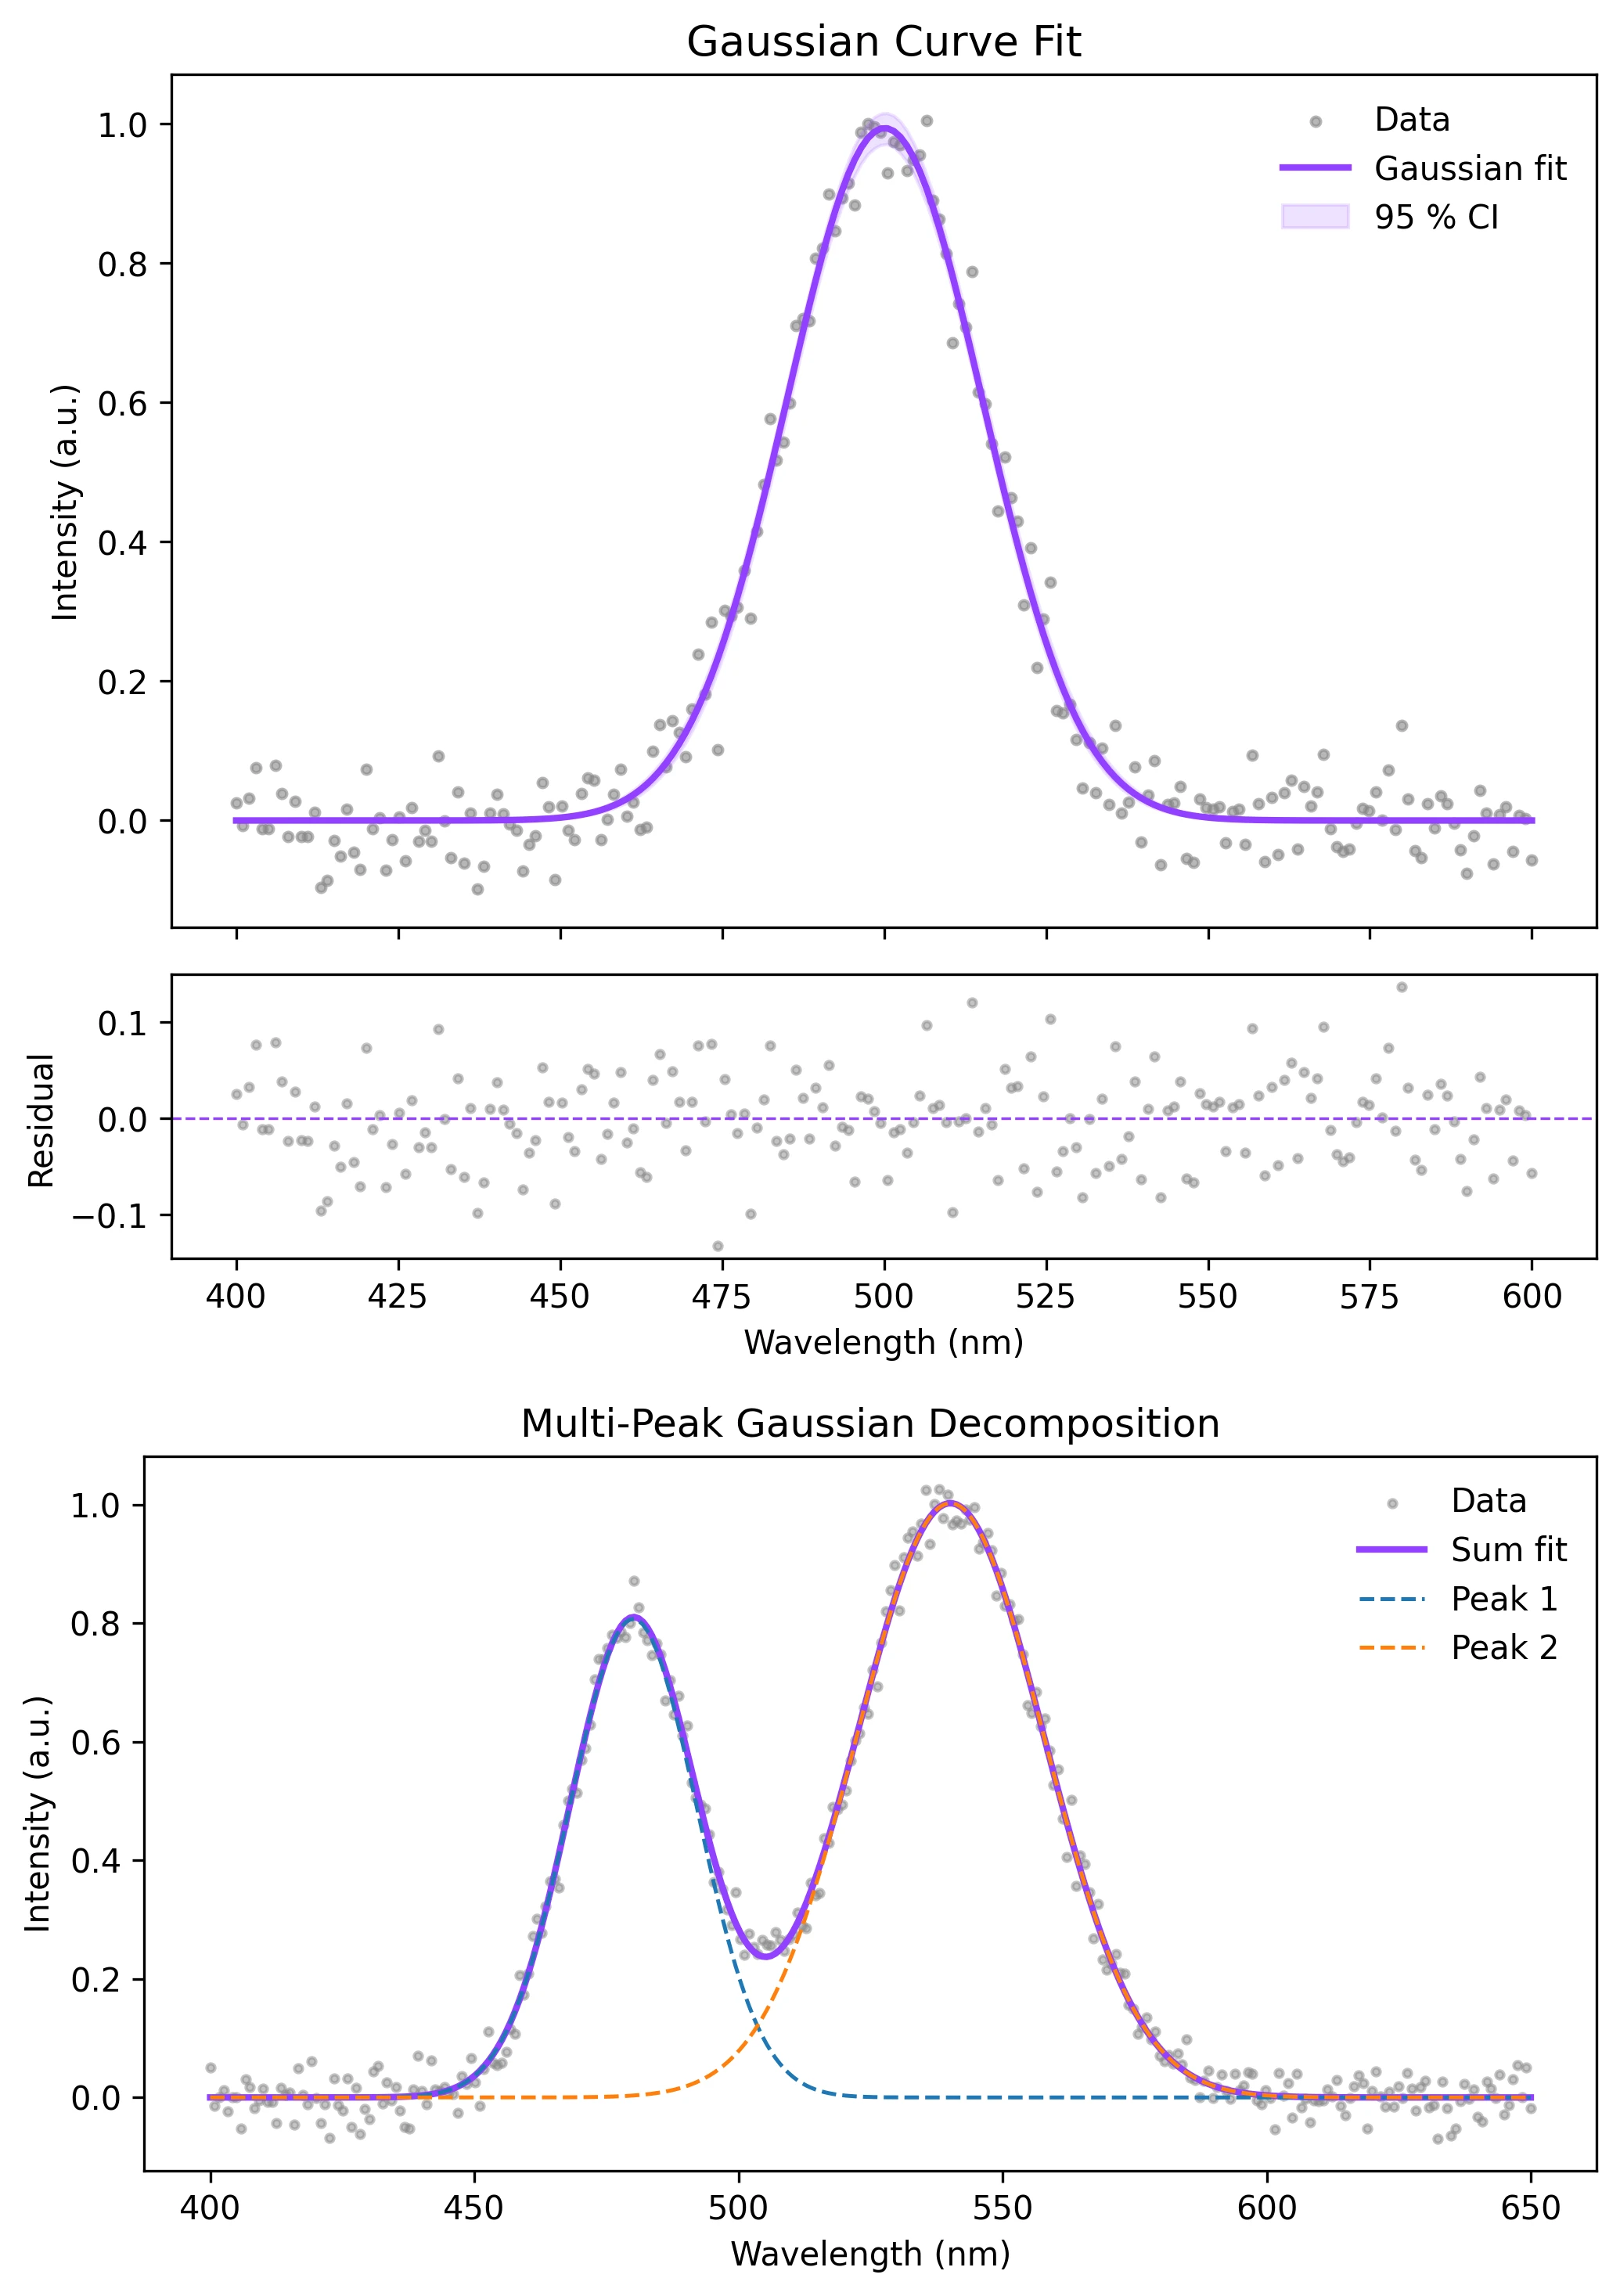
Gaussian Curve Fitting in Python
Fit Gaussian peaks to spectroscopy, chromatography, or any bell-shaped data using scipy.optimize.curve_fit. Extract peak center, amplitude, and width with uncertainties.
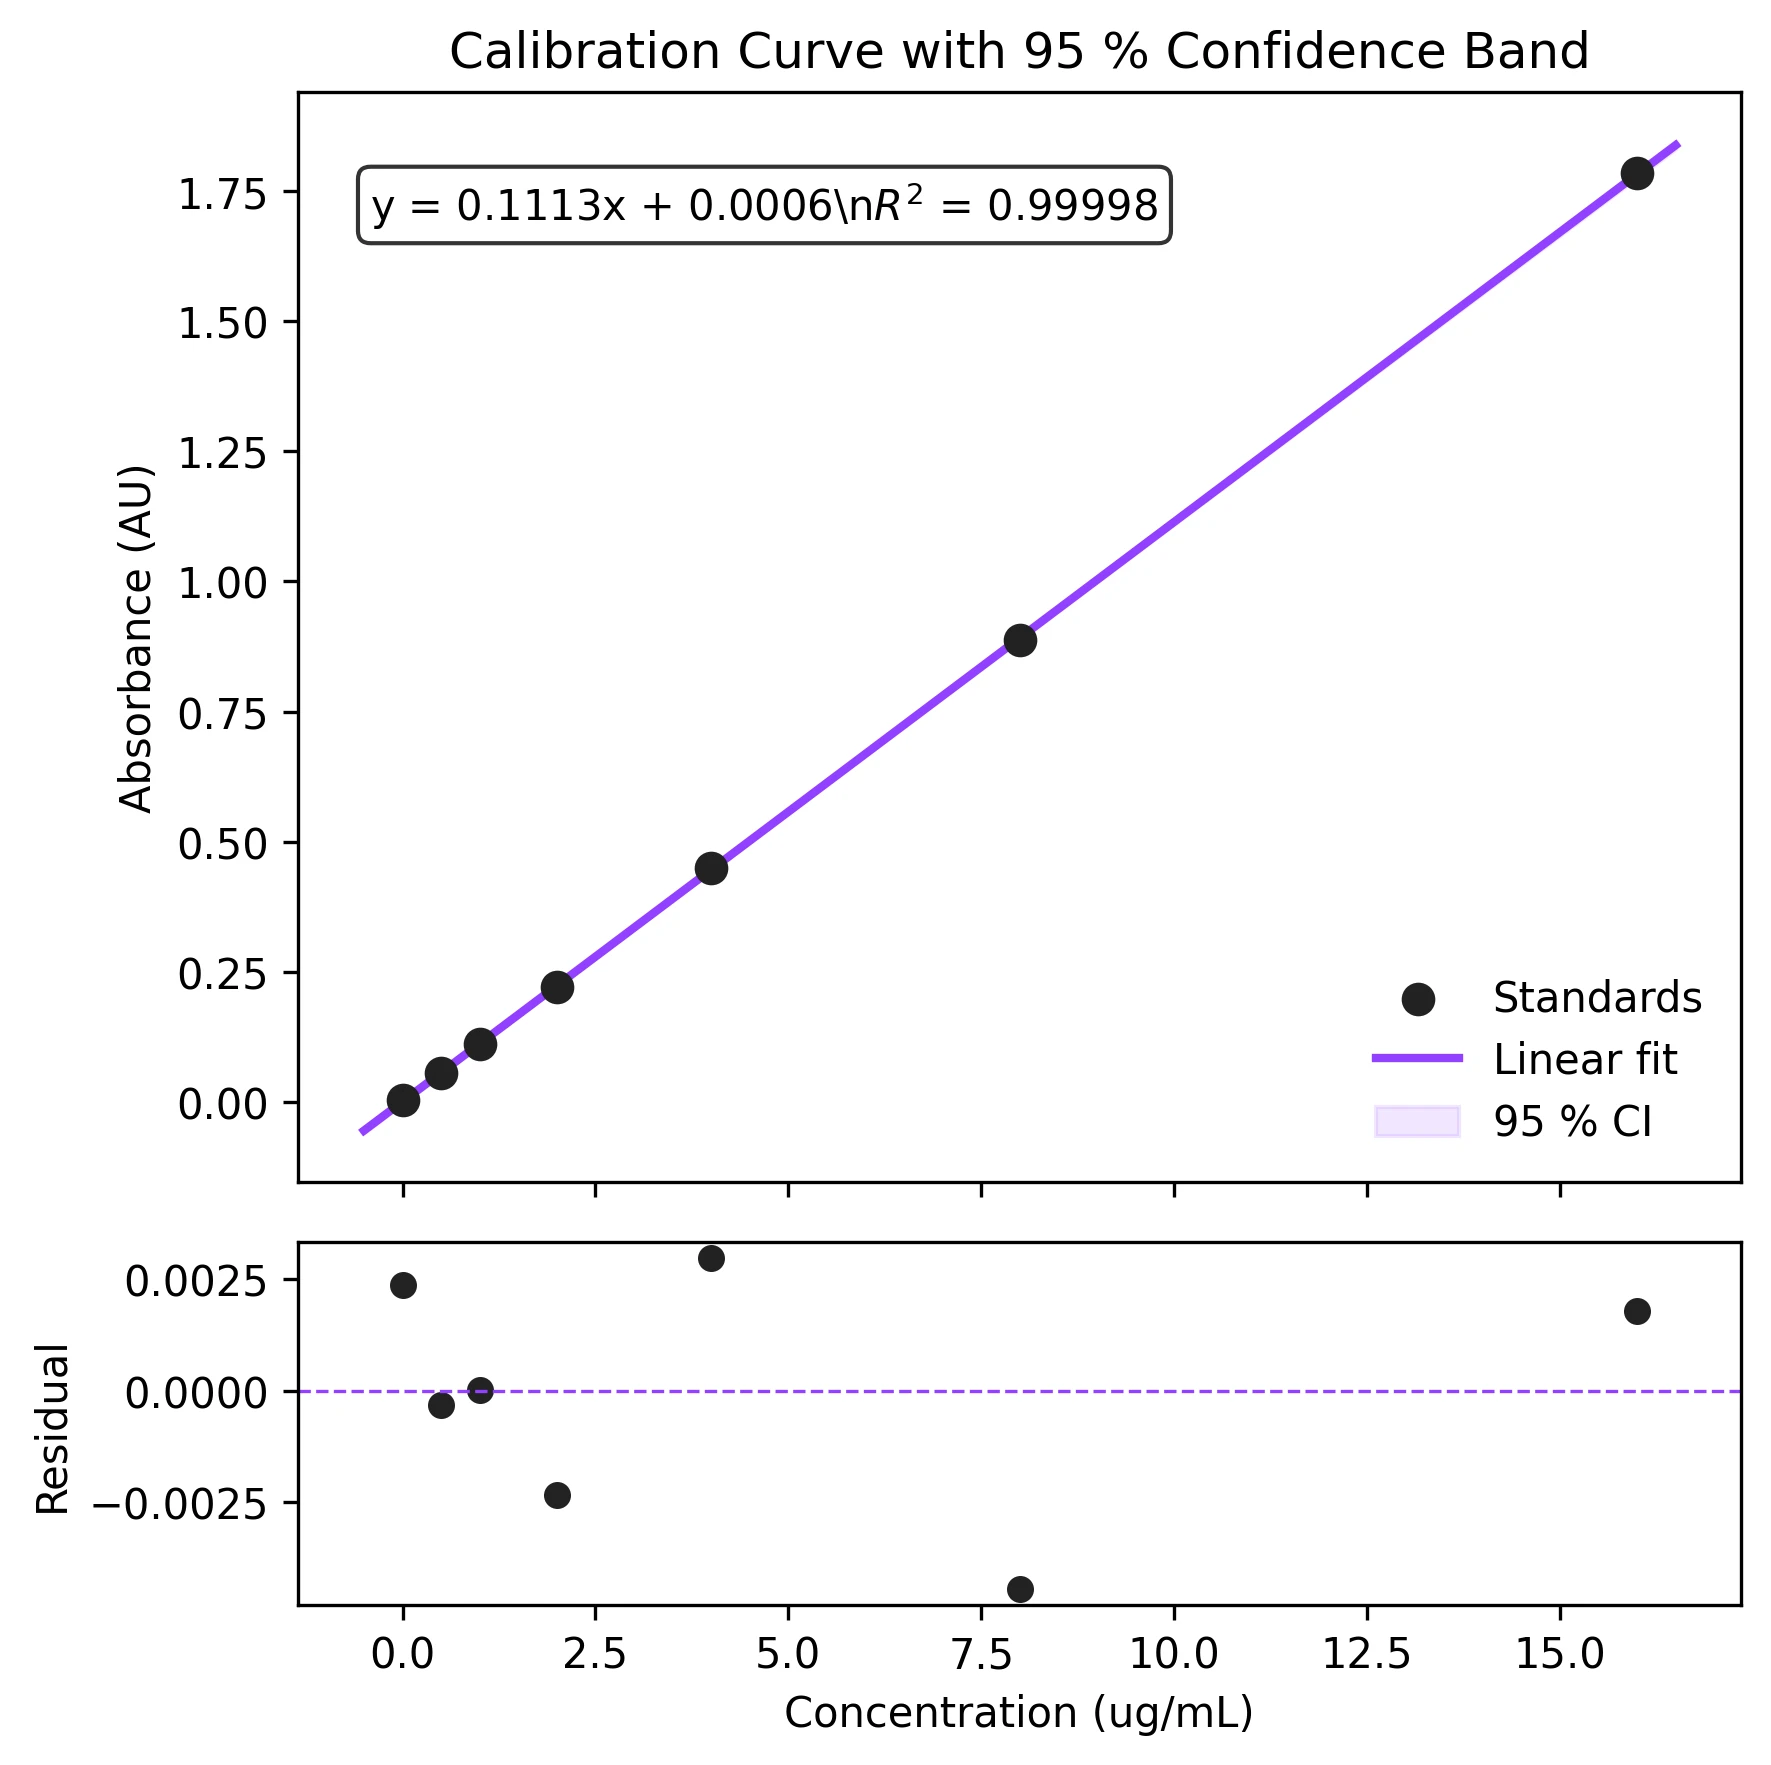
Linear Regression in Python with Confidence Intervals
Build calibration curves and standard curves with linear regression. Includes confidence interval bands, R-squared annotation, and residual diagnostics.
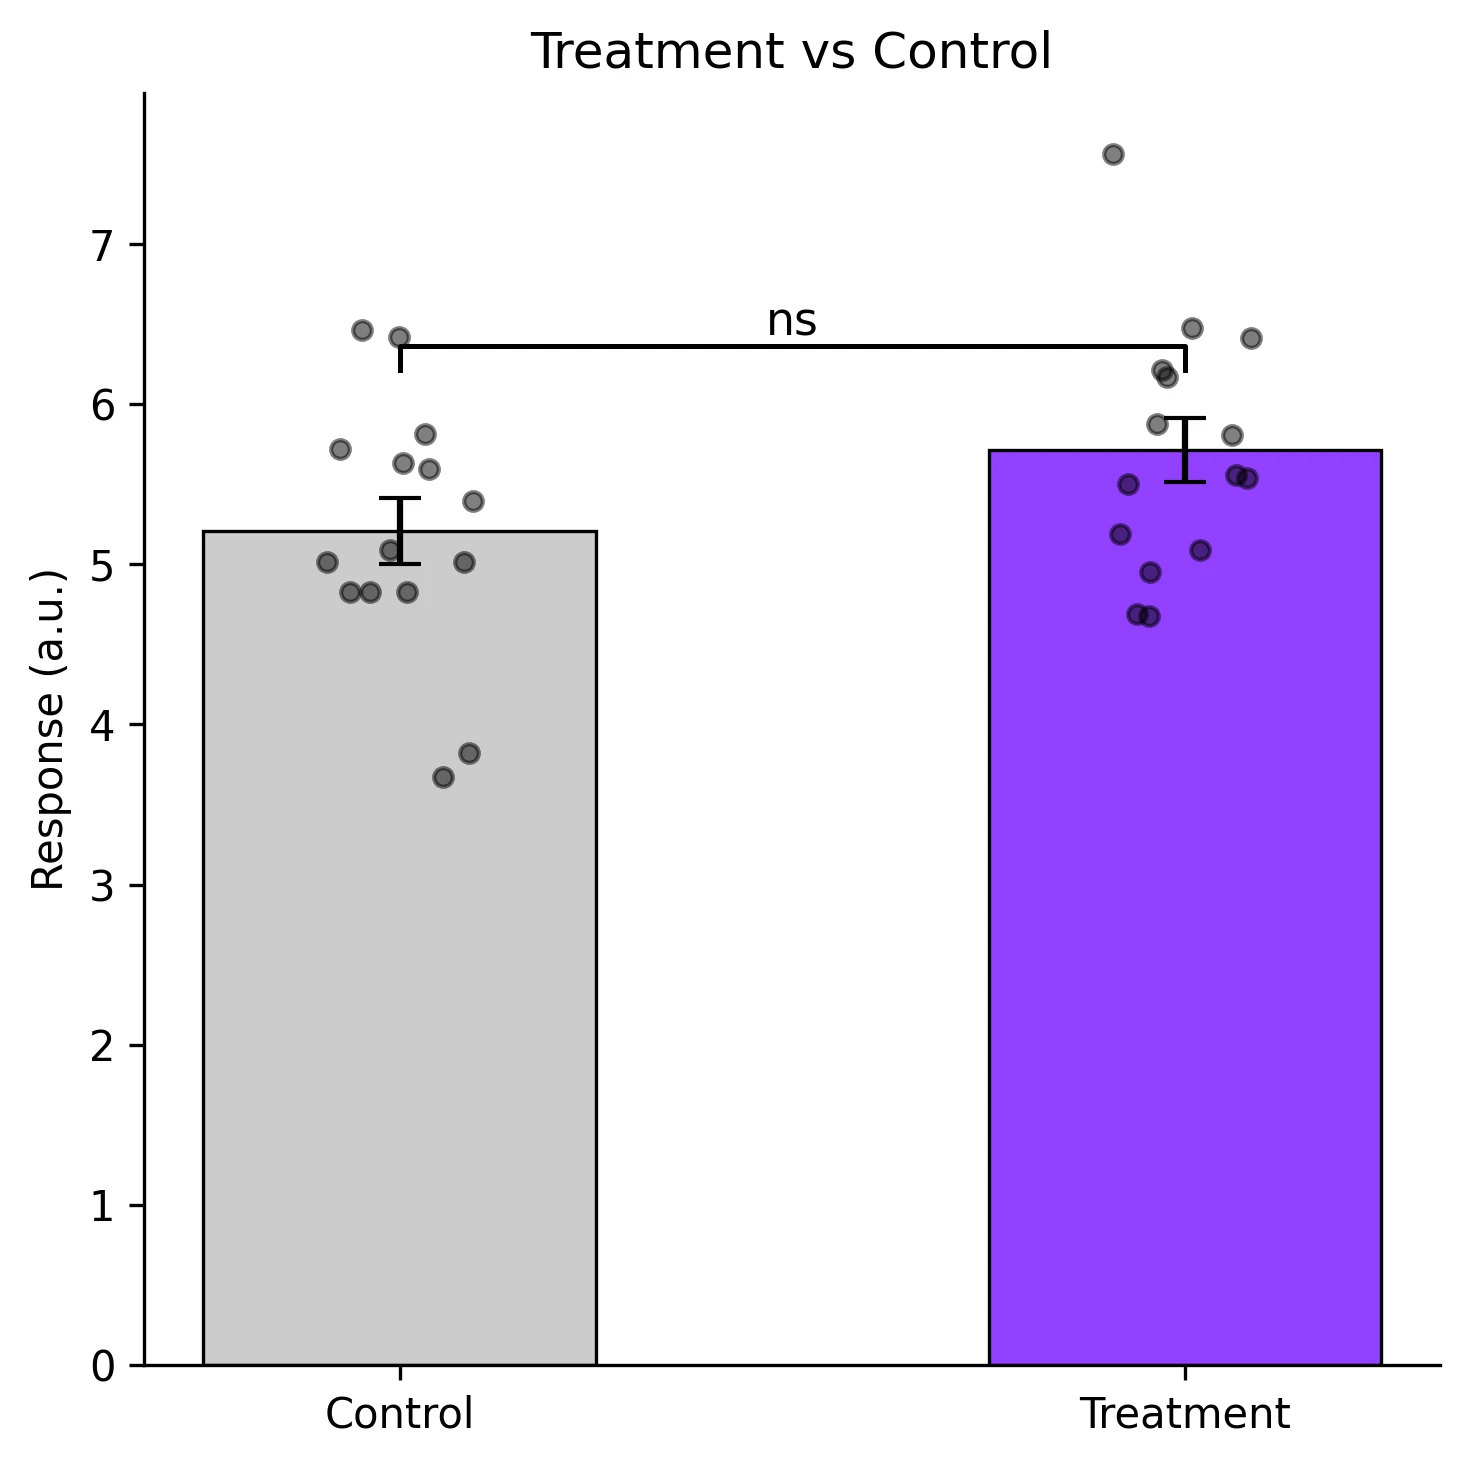
T-Test Visualization in Python with Significance Brackets
Add significance brackets and p-value stars to bar charts. Covers independent, paired, and Welch t-tests with complete matplotlib annotation code.
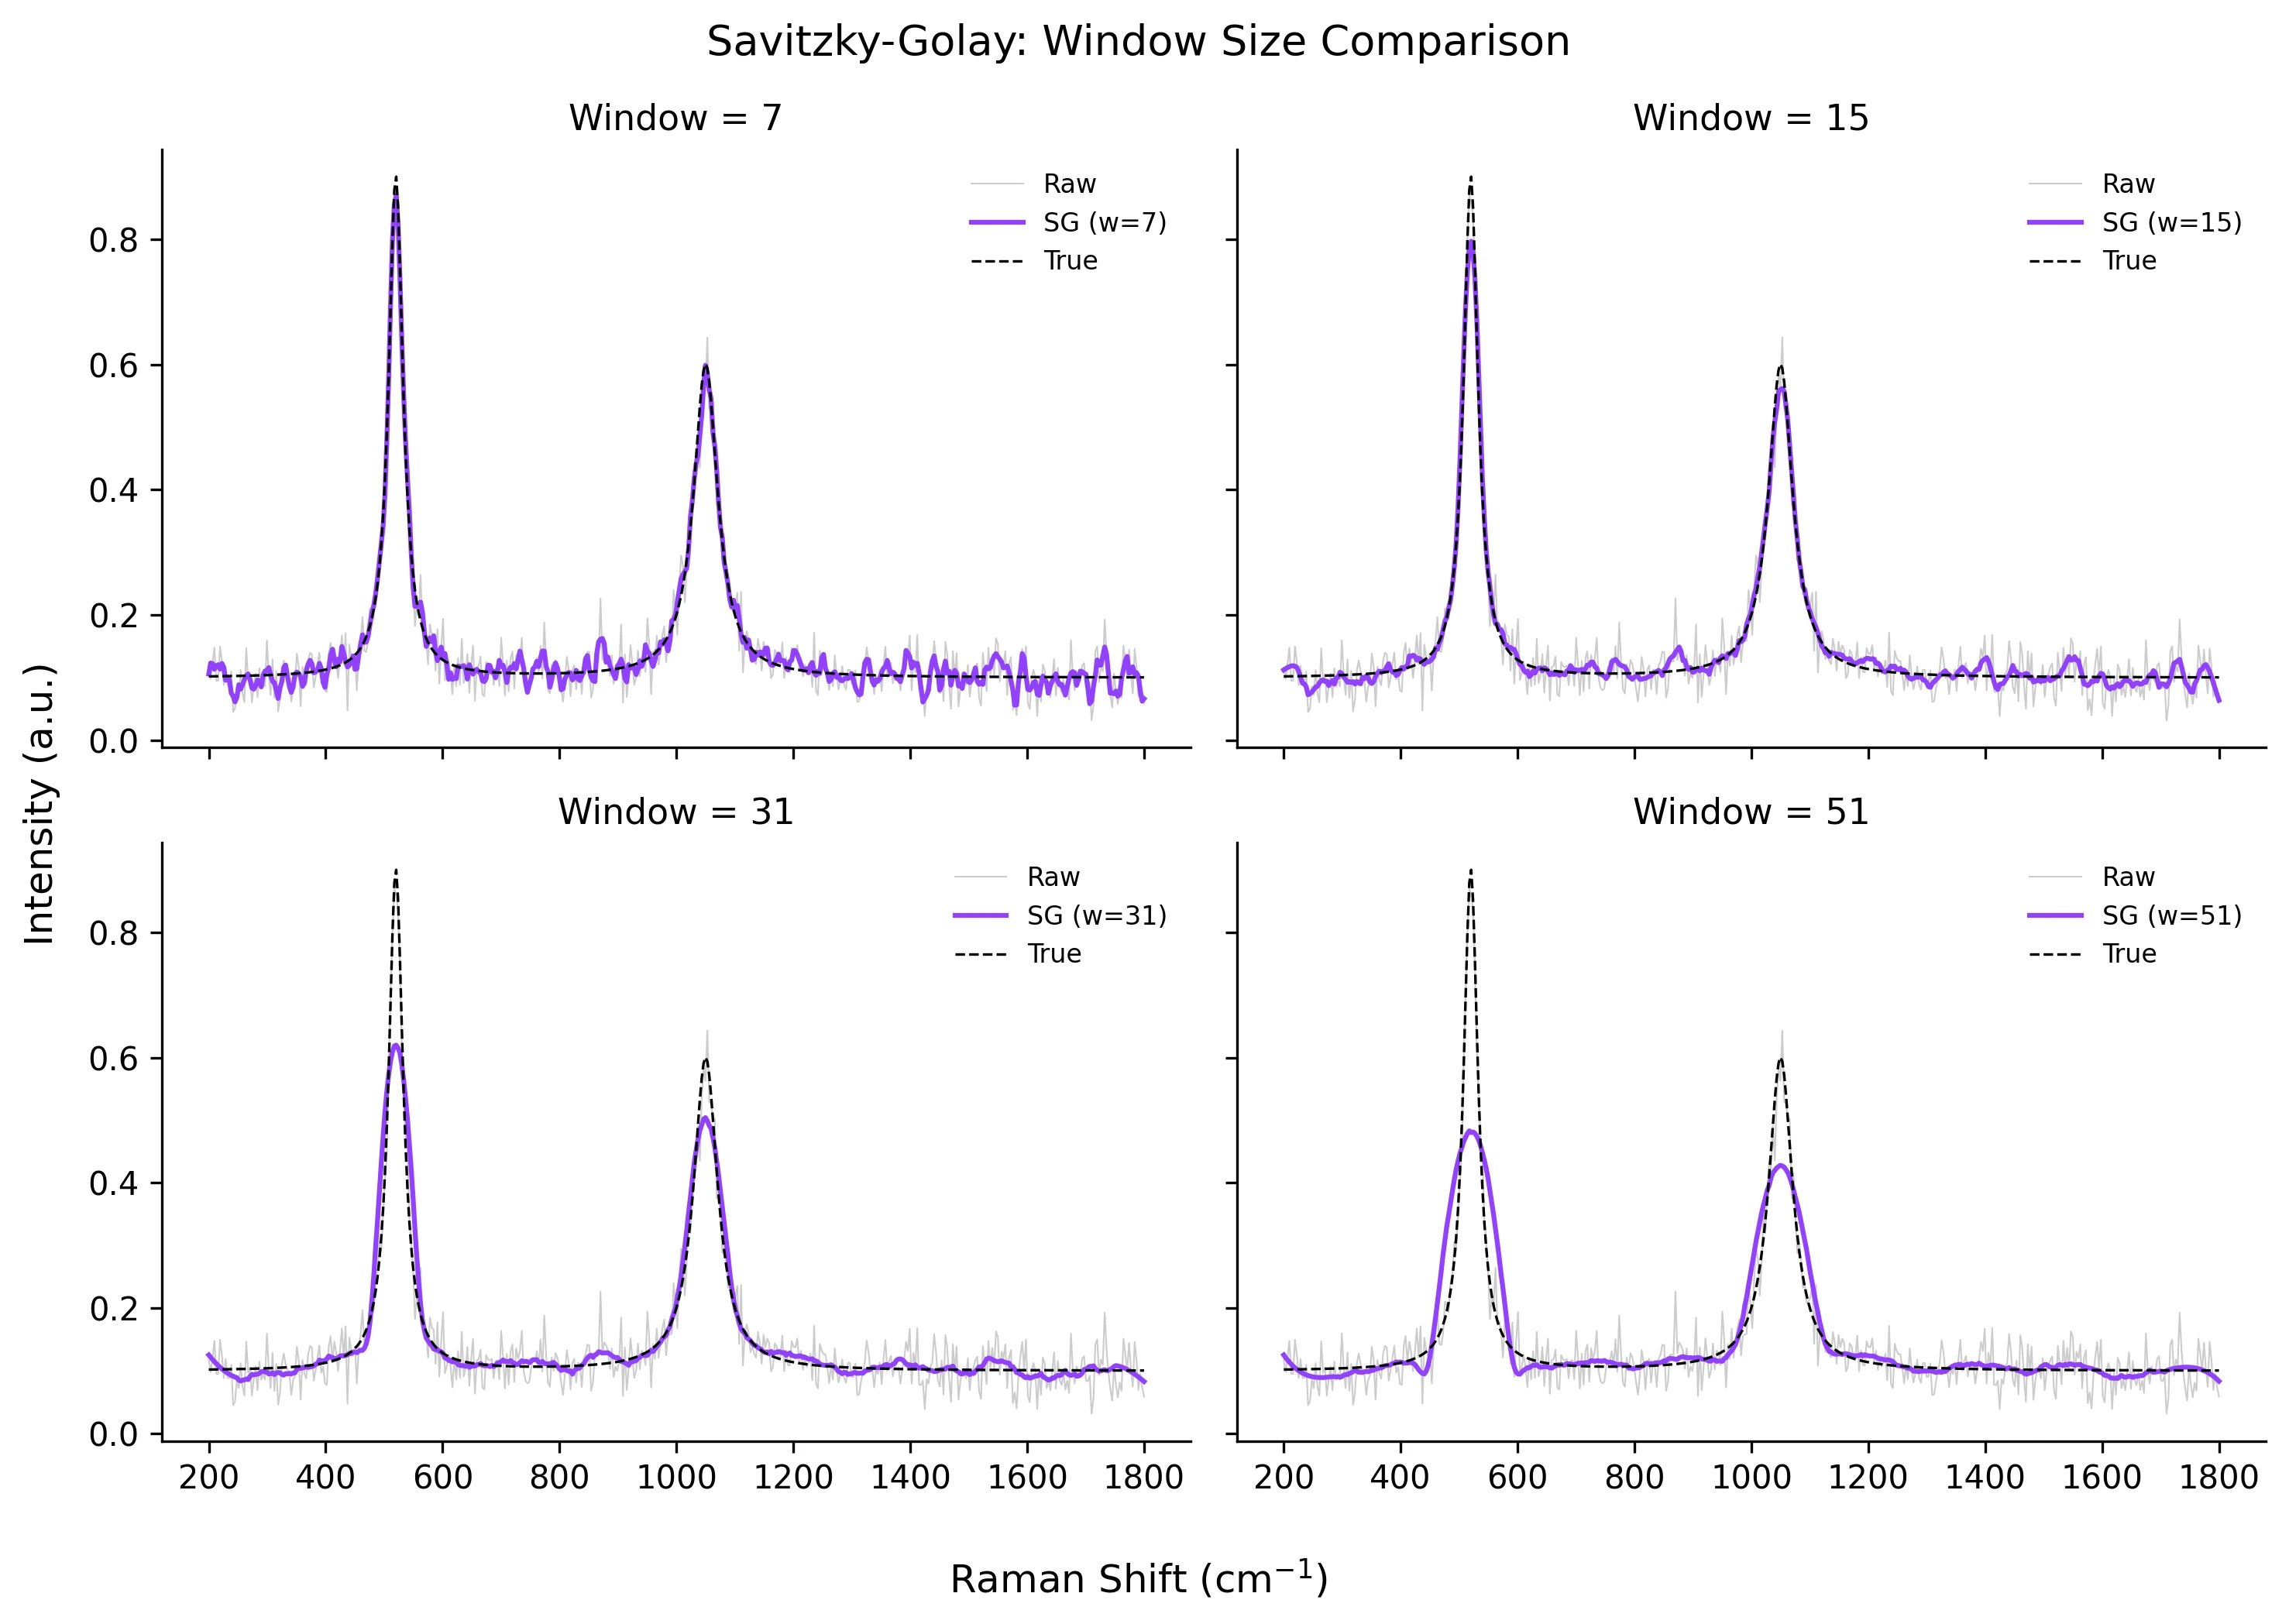
Savitzky-Golay Smoothing in Python for Spectroscopy Data
Smooth spectroscopy and chromatography data while preserving peak shapes. Includes parameter selection guide for window length and polynomial order.
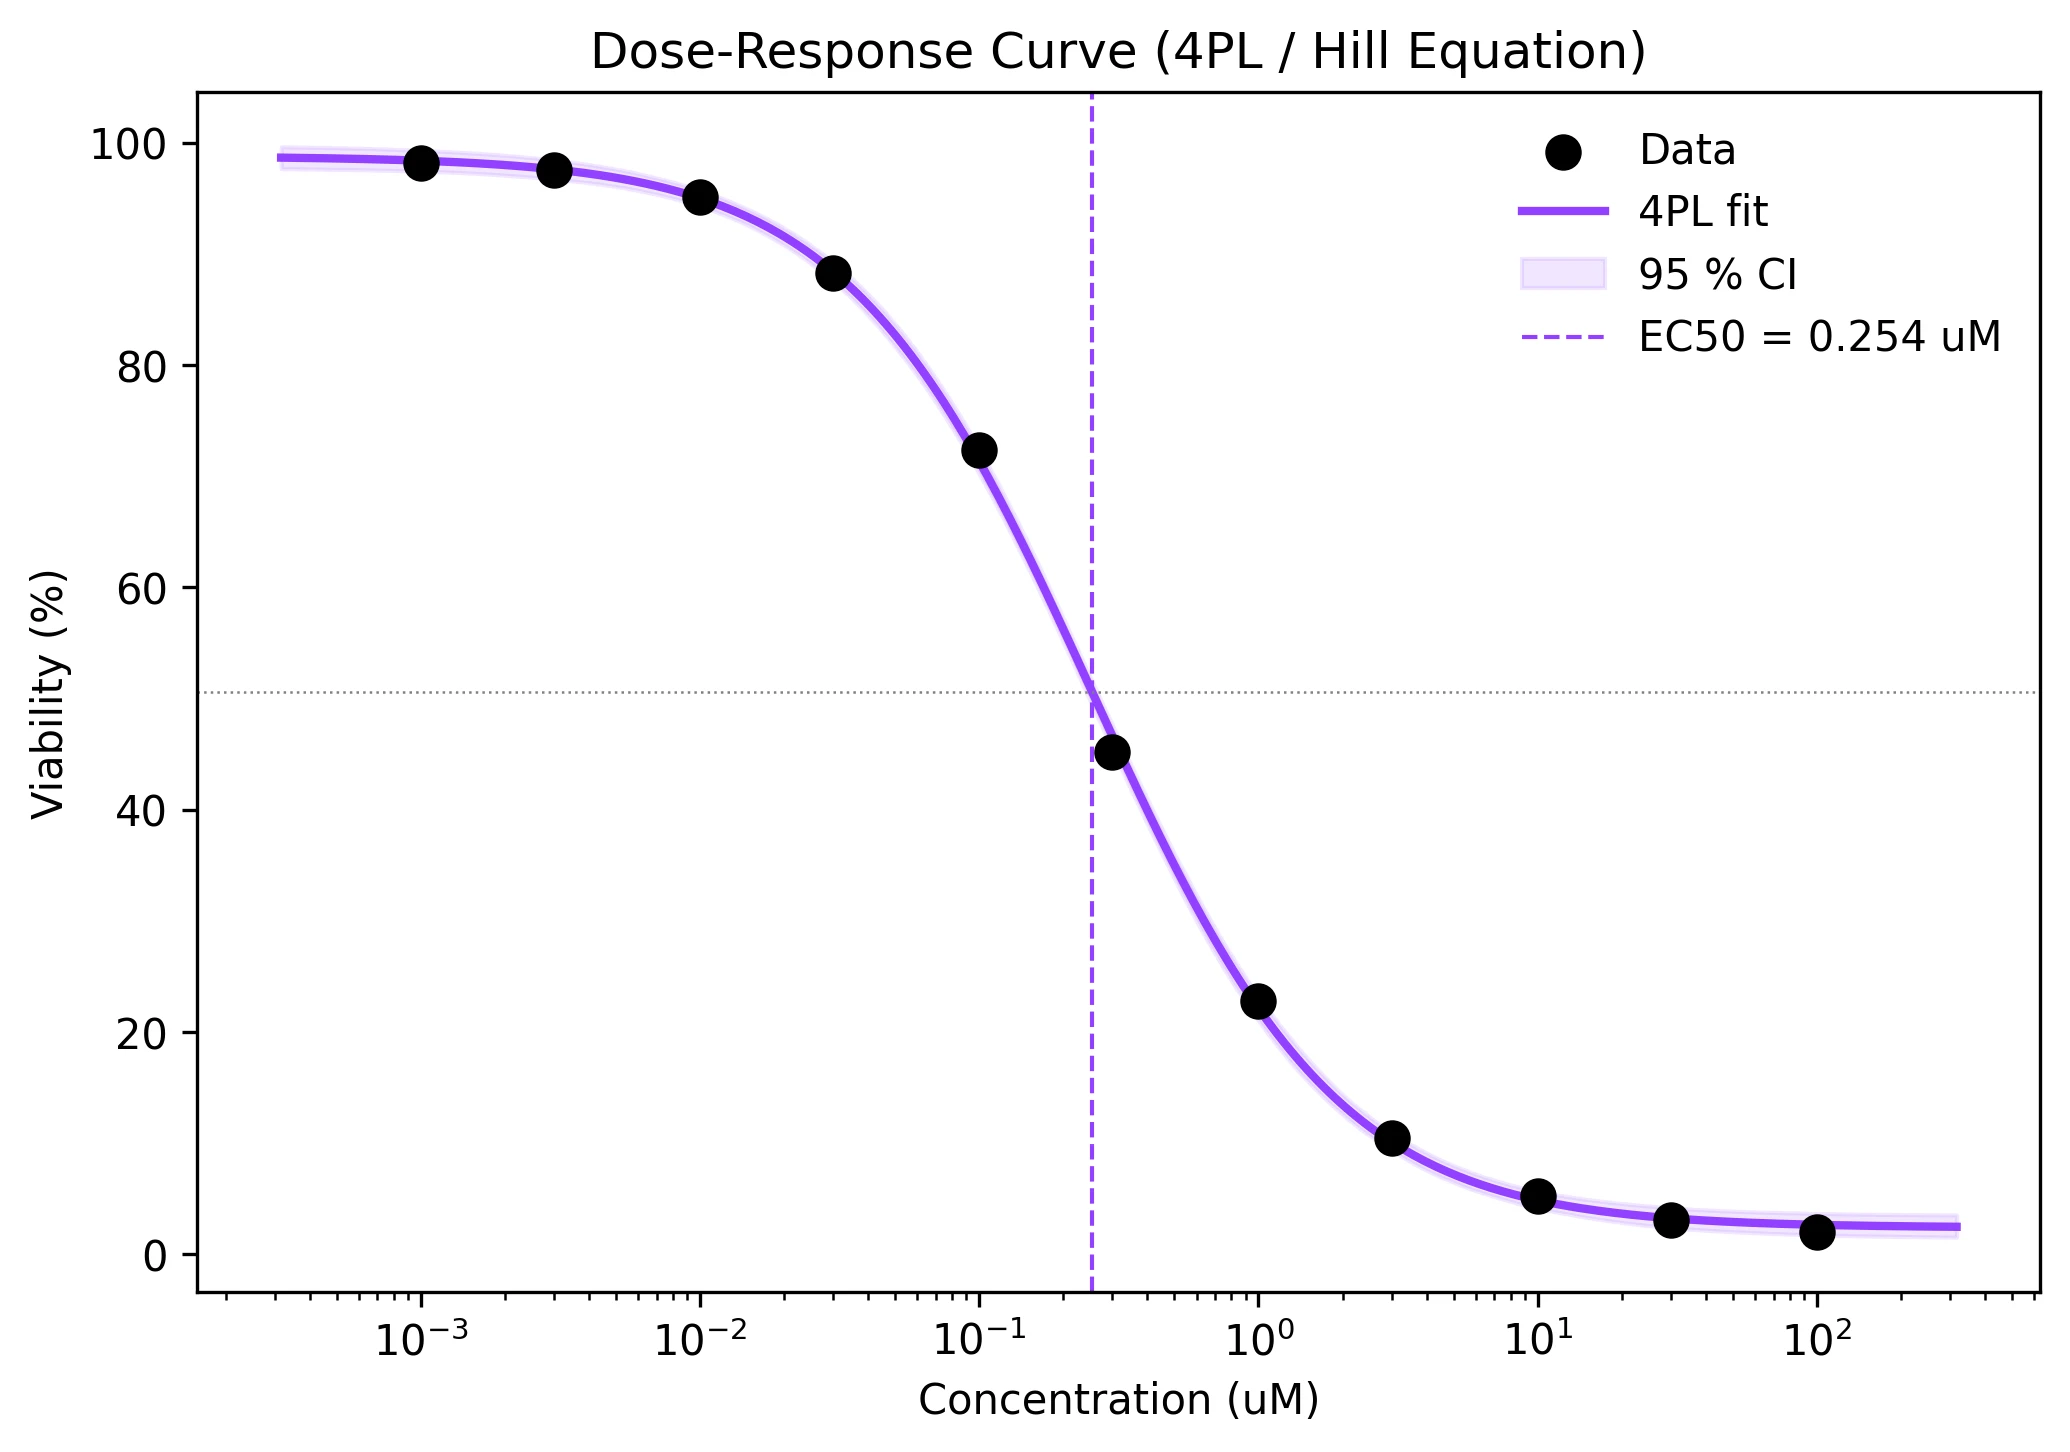
Dose-Response Curve Fitting in Python (Hill Equation, EC50/IC50)
Fit dose-response data using the Hill equation and 4PL model. Extract EC50/IC50 with confidence intervals and produce publication-ready sigmoidal curves.
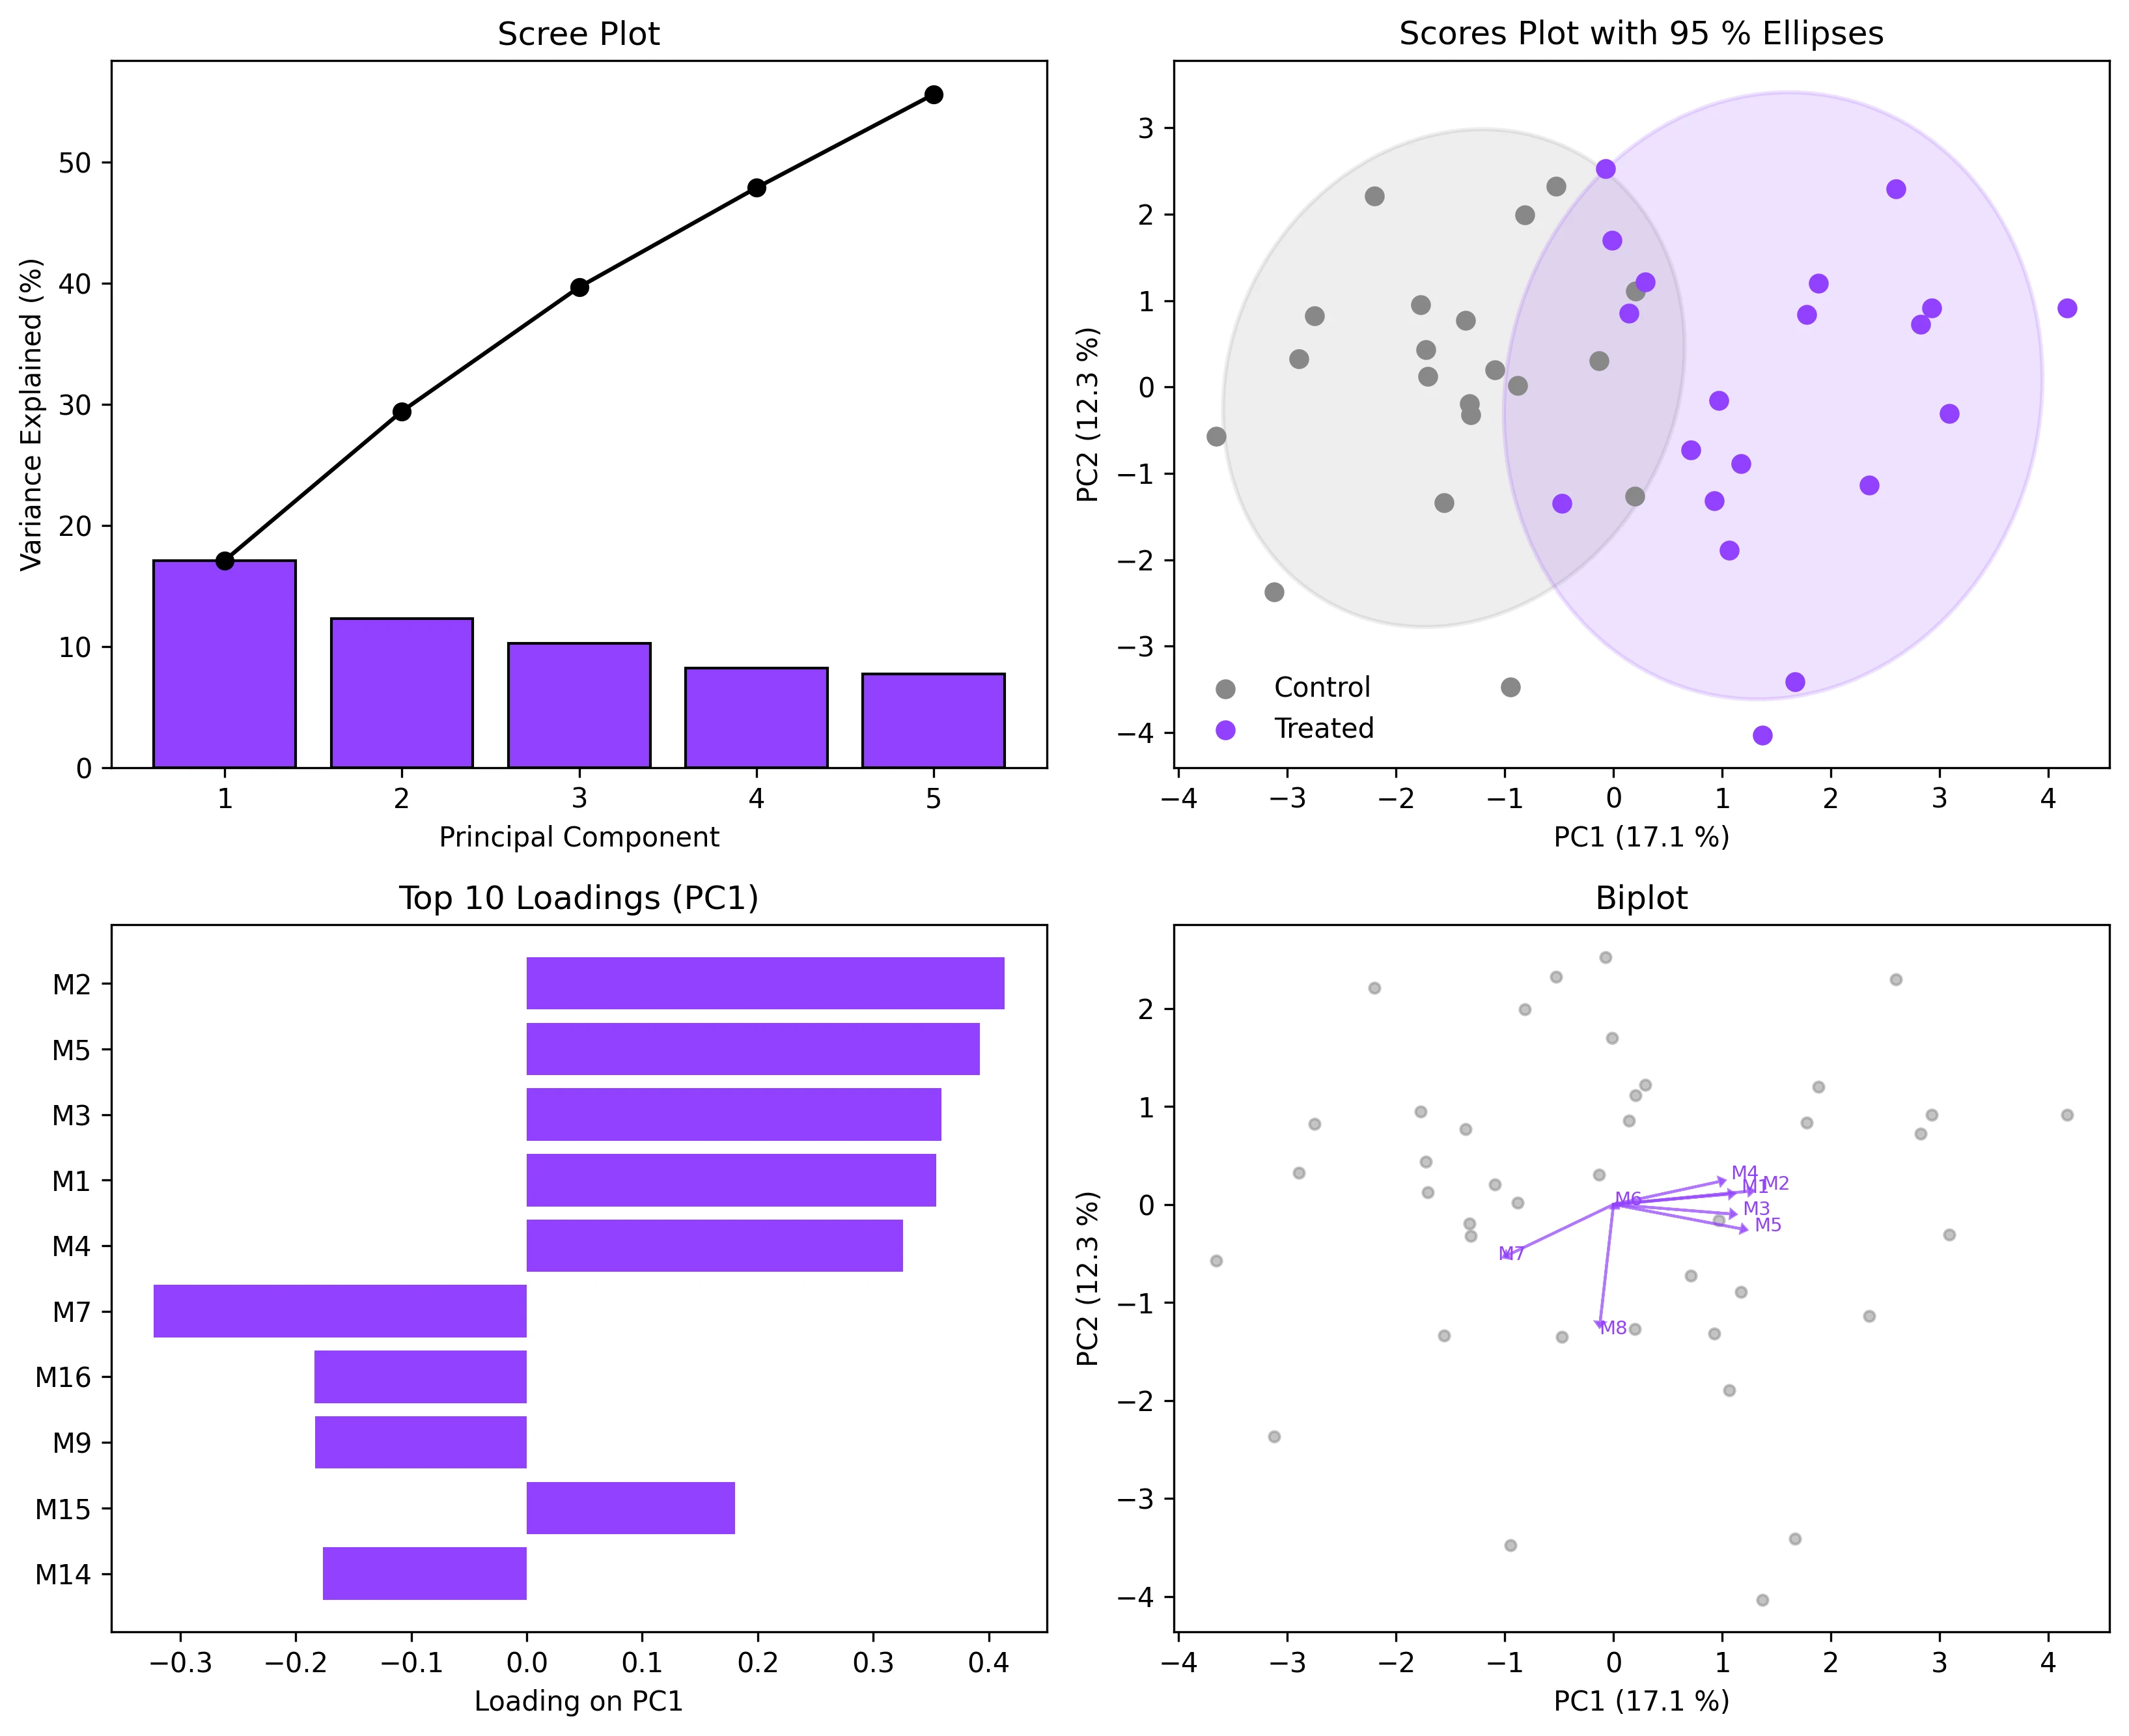
PCA Visualization in Python: Scores, Loadings, and Biplots
Create scree plots, scores plots with confidence ellipses, loadings plots, and biplots for PCA results. Covers interpretation for omics and environmental data.
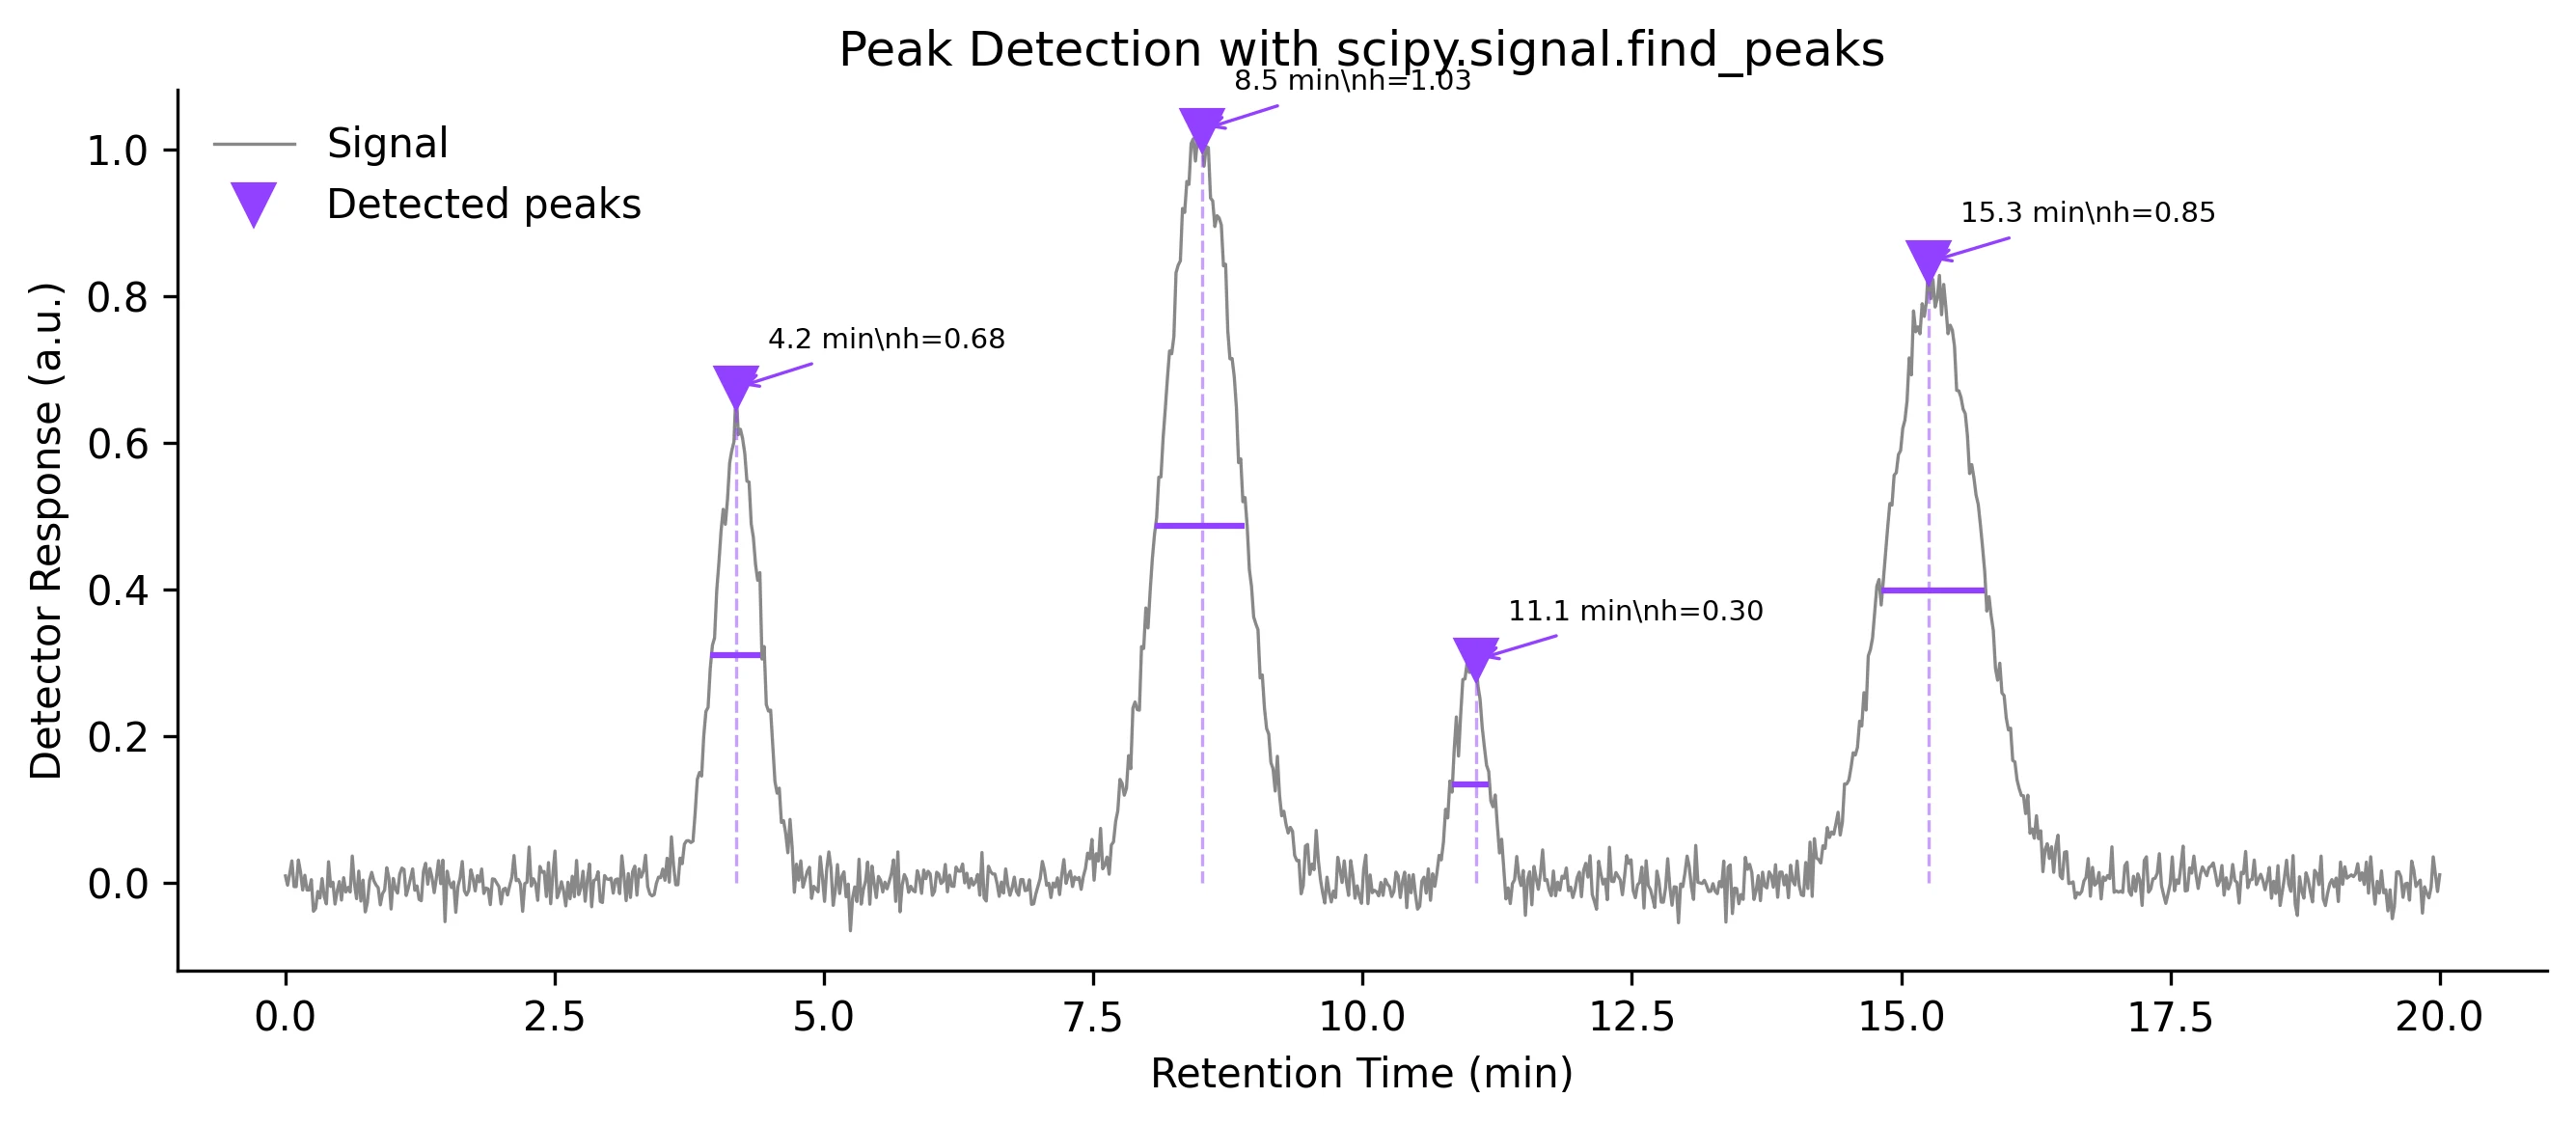
Peak Detection in Python with scipy.signal.find_peaks
Detect peaks in experimental data using scipy.signal.find_peaks. Covers prominence, height, threshold parameters with visualizations and peak area integration.
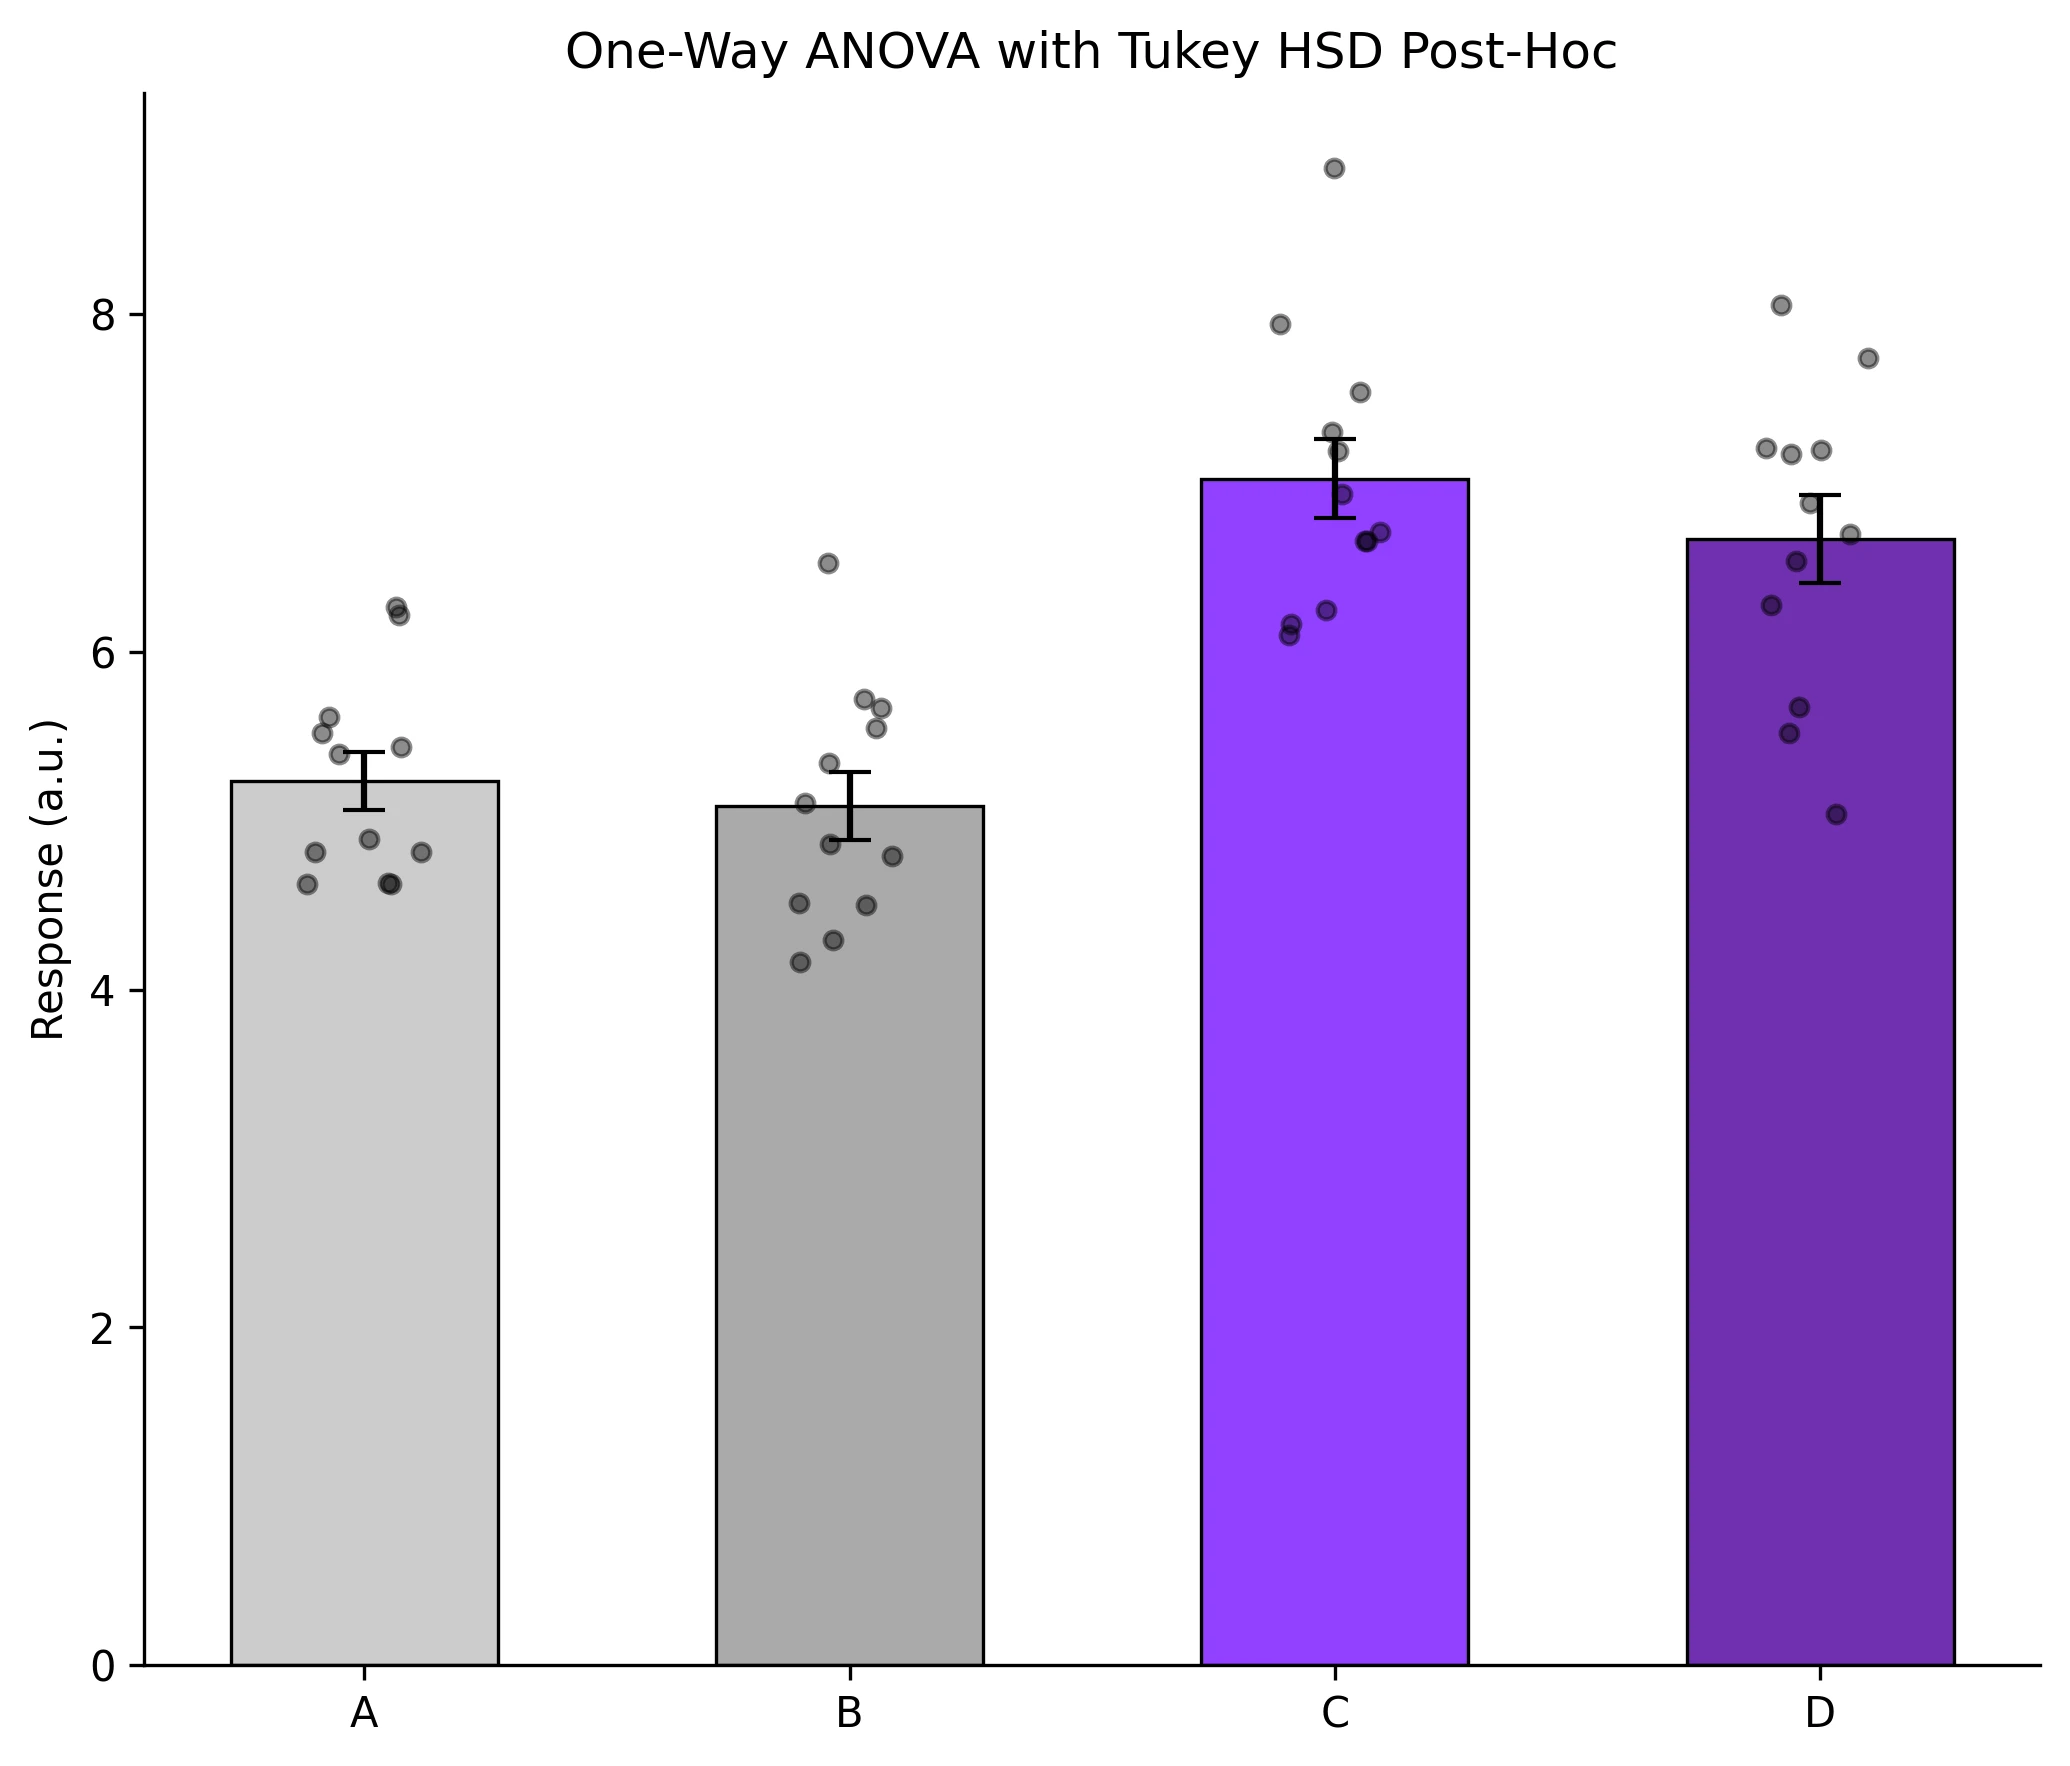
ANOVA Visualization in Python with Post-Hoc Significance Brackets
Run one-way ANOVA with Tukey HSD post-hoc and add significance brackets to grouped bar charts. Includes non-parametric Kruskal-Wallis with Dunn test alternative.
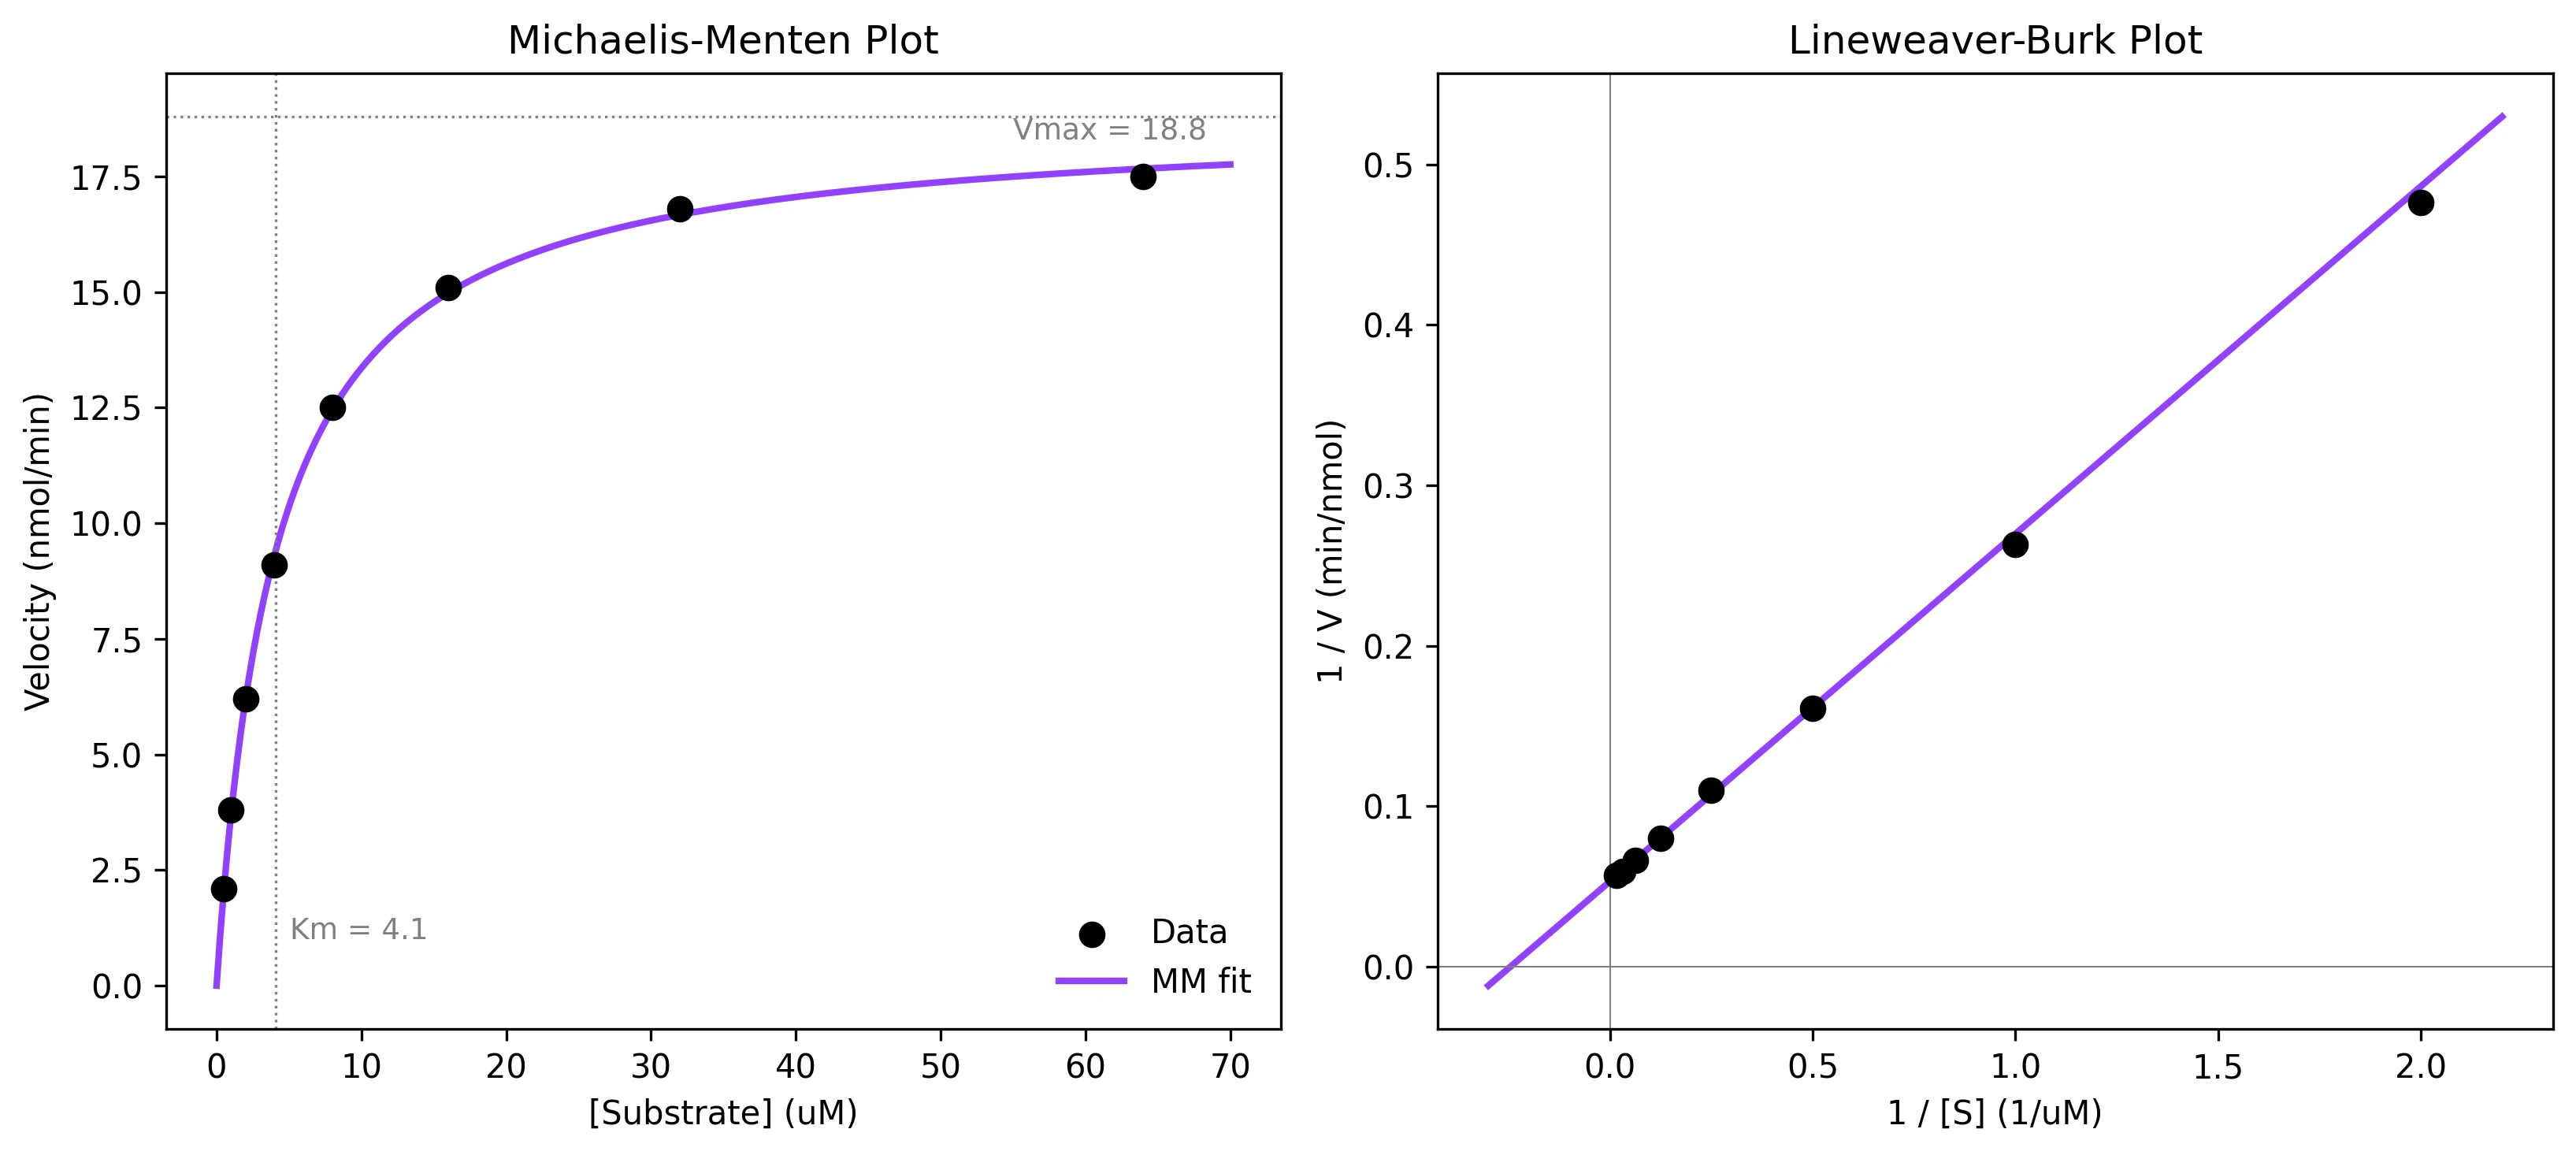
Michaelis-Menten Fitting in Python for Enzyme Kinetics
Fit Michaelis-Menten enzyme kinetics data to extract Km and Vmax with uncertainties. Includes Lineweaver-Burk plots and Hill equation extension.
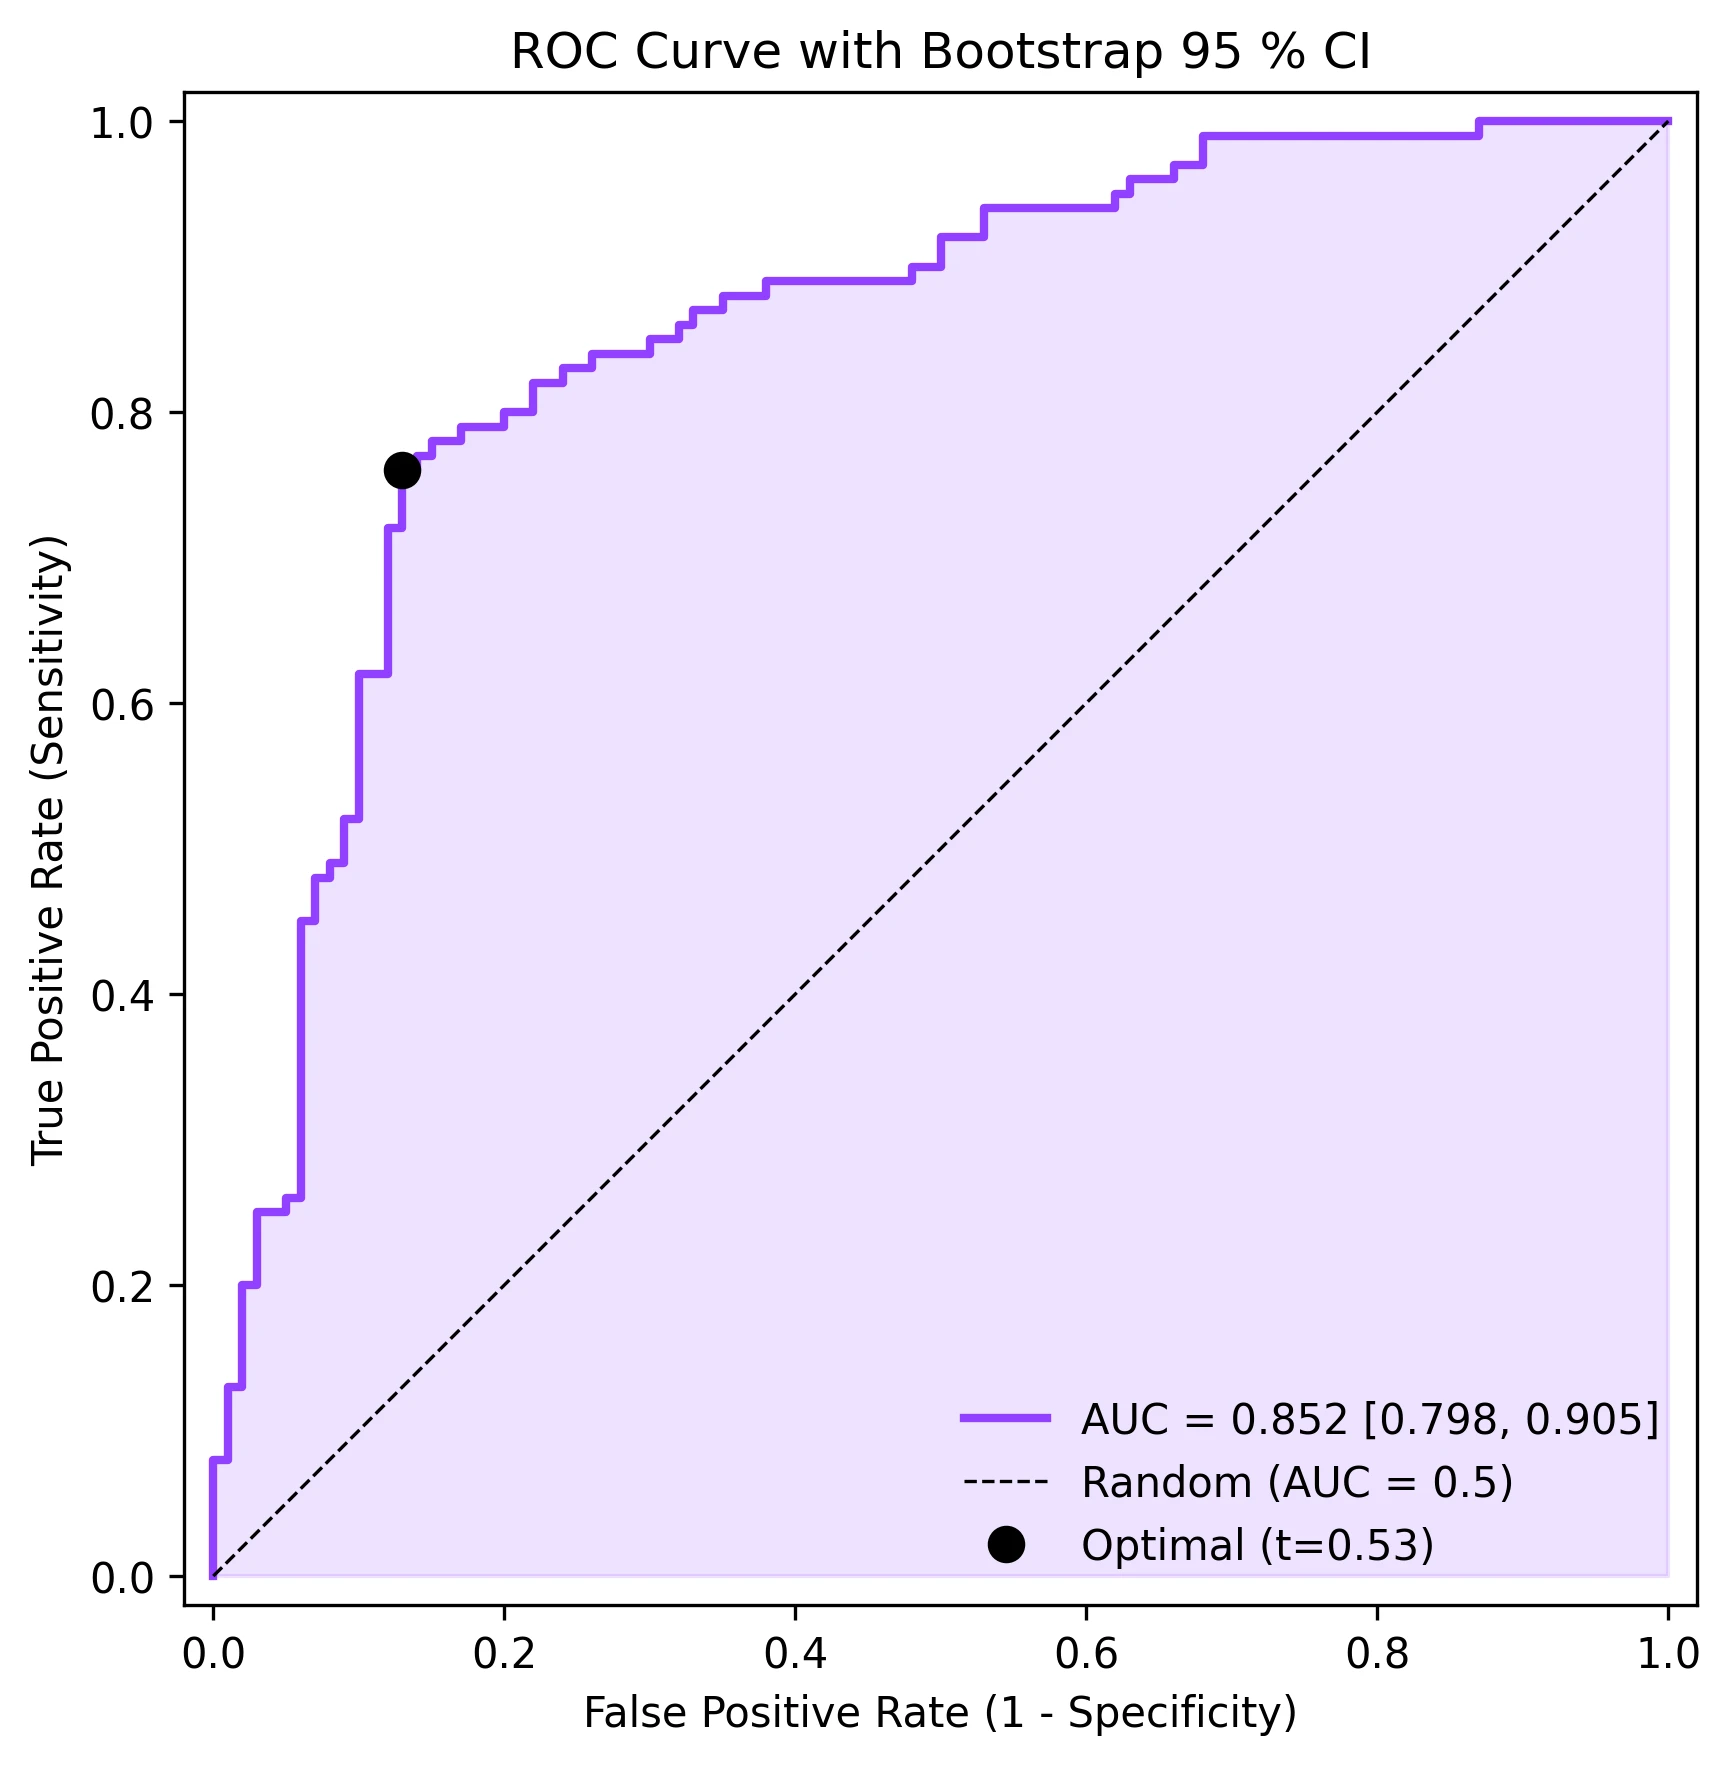
ROC Curve and AUC Analysis in Python
Generate ROC curves with AUC, bootstrap confidence intervals, optimal threshold identification, and multi-class or multi-classifier comparison plots.
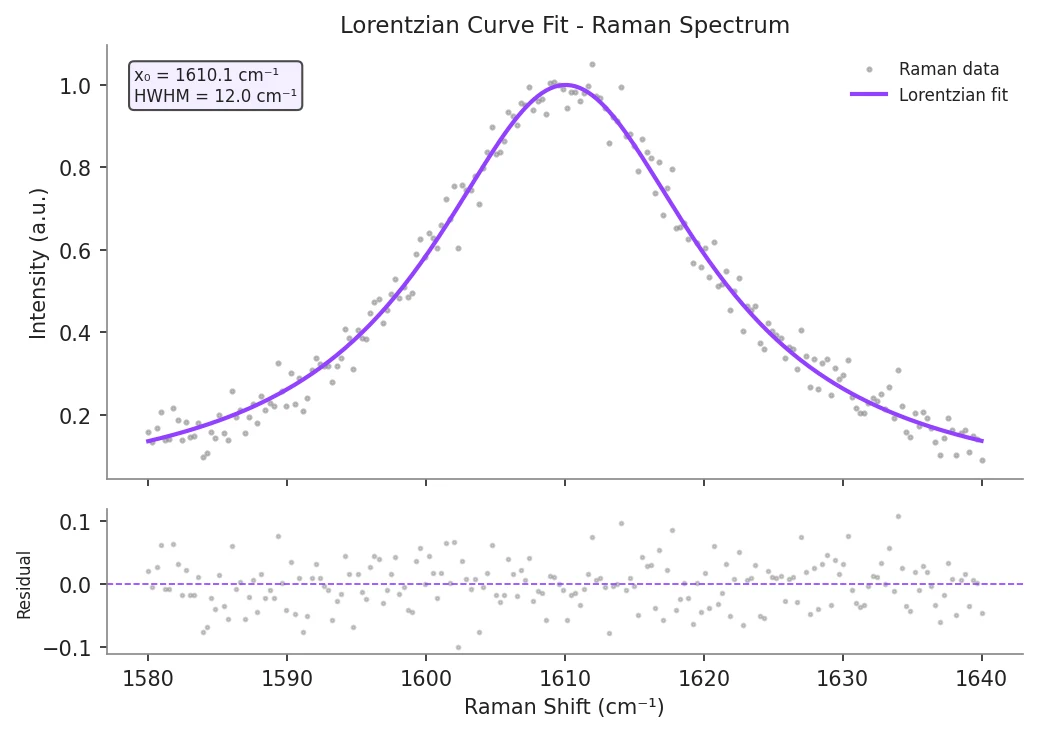
Lorentzian Curve Fitting in Python
Fit Lorentzian (Cauchy) profiles to spectroscopy data with heavier tails than Gaussian peaks, common in NMR and Raman broadening.
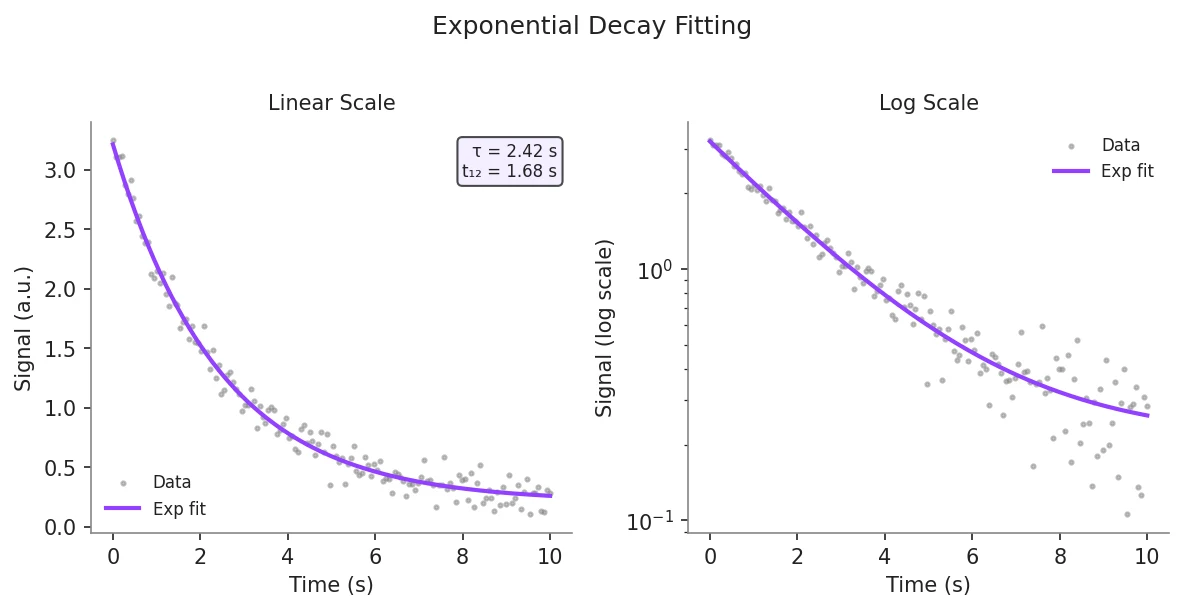
Exponential Decay Fitting in Python
Fit single and double exponential decay models to extract rate constants, half-lives, and time constants from fluorescence, pharmacokinetics, or radioactive decay data.
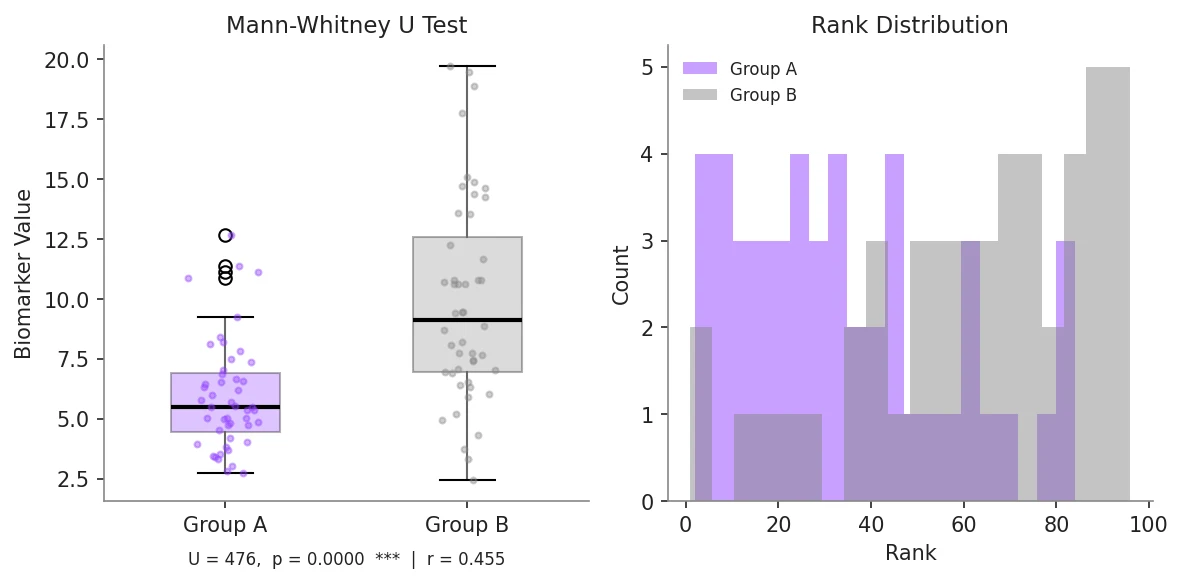
Mann-Whitney U Test in Python
Non-parametric alternative to the independent t-test for comparing two groups when data is not normally distributed, using rank-based methods.
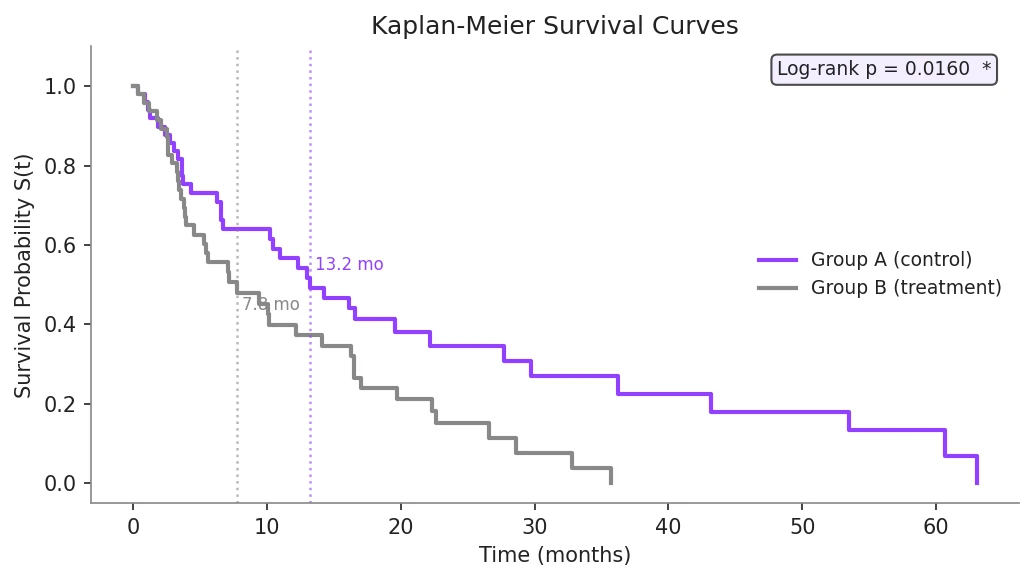
Kaplan-Meier Survival Analysis in Python
Estimate survival functions from censored time-to-event data with confidence intervals and log-rank tests for group comparison.

4-Parameter Logistic Curve Fitting in Python
Fit 4-parameter logistic curves for assay standard curves, ELISA data, and dose-response experiments with EC50 or IC50 reporting.
Wilcoxon Signed-Rank Test in Python
Compare paired measurements with a nonparametric test when the differences are not normally distributed.
FFT Spectrum Analysis in Python
Analyze periodic signals in the frequency domain with FFT amplitude spectra, power spectra, and harmonic identification.

Wavelet Denoising in Python
Remove noise from time-series and spectroscopy data with wavelet thresholding while preserving spikes, edges, and transient structure.

Baseline Correction in Python for Spectroscopy
Remove baseline drift from spectroscopy and chromatography traces before peak analysis or quantitative fitting.

Bland-Altman Plot in Python
Assess agreement between two measurement methods with bias, limits of agreement, and proportional bias diagnostics.

Mixed-Effects Model Visualization in Python
Visualize repeated-measures and clustered data with mixed-effects models, fixed effects, random intercepts, and confidence bands.
Hierarchical Clustering Heatmap in Python
Cluster rows and columns to reveal structure in gene expression, similarity matrices, and other multivariate datasets.

Correlation Analysis Heatmap in Python
Visualize relationships between variables with annotated Pearson or Spearman correlation heatmaps.
Log-Rank Test Visualization in Python
Compare Kaplan-Meier survival curves between groups with log-rank testing, censor marks, and risk-aware interpretation.
What Every Technique Page Includes
Every guide in this encyclopedia follows the same structure so you always know where to find what you need.
Live Code Editor
Run the visualization code directly in your browser. Edit parameters and see the updated plot instantly - no local Python setup required.
Complete Python Code
Copy-ready scipy, numpy, and matplotlib code with real sample data. Includes implementation code and visualization code separately.
Mathematical Foundation
The underlying equation and parameter descriptions, plus guidance on when to use (and when not to use) each technique.
Common Errors & FAQ
The mistakes that trip up most researchers, with exact error messages, root causes, and step-by-step fixes.
Related Resources
Apply These Techniques Instantly
Upload your dataset and Plotivy's AI applies the right technique, generates the code, and produces a publication-ready figure - no Python setup required.