Menu
Refer a Friend
Share your link — earn +15 permanent plots for every friend who joins.
Sign in to get your referral linkLearn Plotivy with Video Tutorials
Watch practical video guides for scientific data visualization, reproducible Python analysis, AI-assisted plotting, and publication-ready research figures.
Tutorial focus
What these Plotivy tutorials cover
This page is optimized for researchers looking for Plotivy tutorials, scientific data visualization videos, AI plotting workflows, and publication figure guidance. The current videos cover the product basics, a pitch overview, and a reproducible photonics workflow.
- Start a Plotivy analysis from raw research data
- Create publication-ready figures with AI-assisted Python code
- Understand the difference between exploratory and explanatory visualization
- Export figures for journal submission and reproducible research records
Keep learning
Related learning paths
Introduction
Get started with Plotivy and learn the basics
Click to play
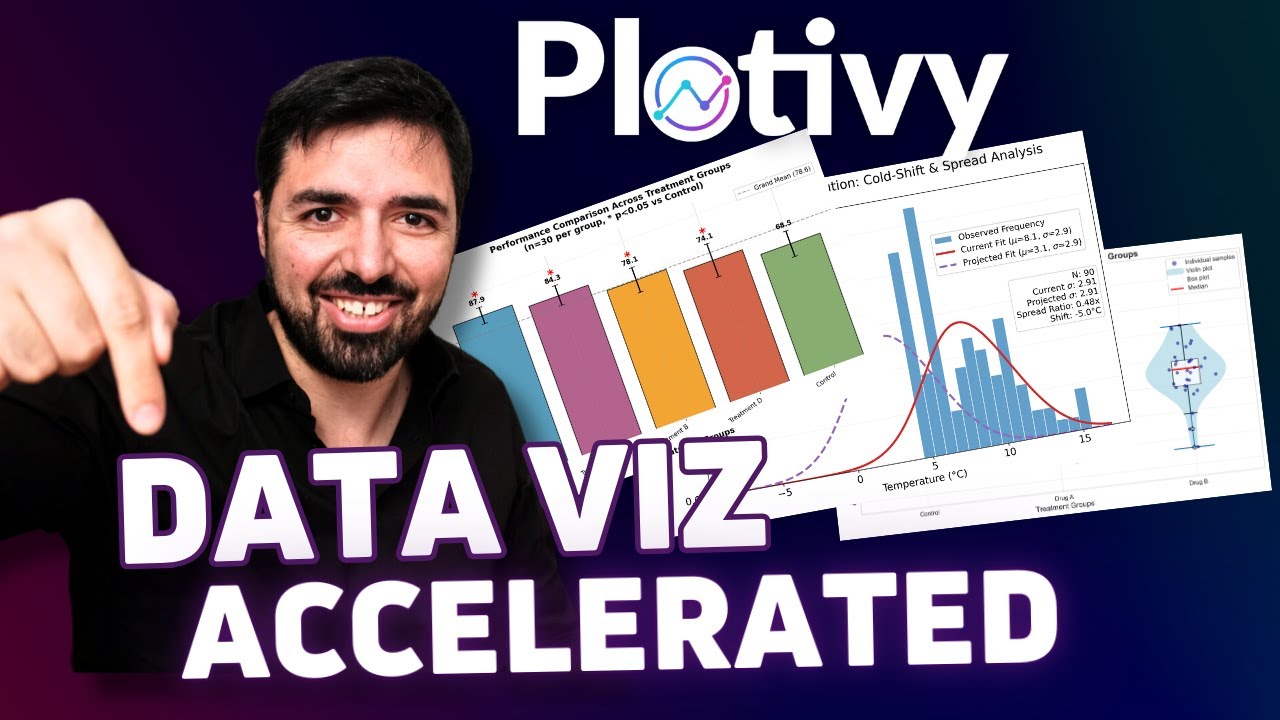
Introduction to Plotivy
A general introduction to Plotivy: discover how to create stunning scientific visualizations with our AI-powered platform.
Click to play
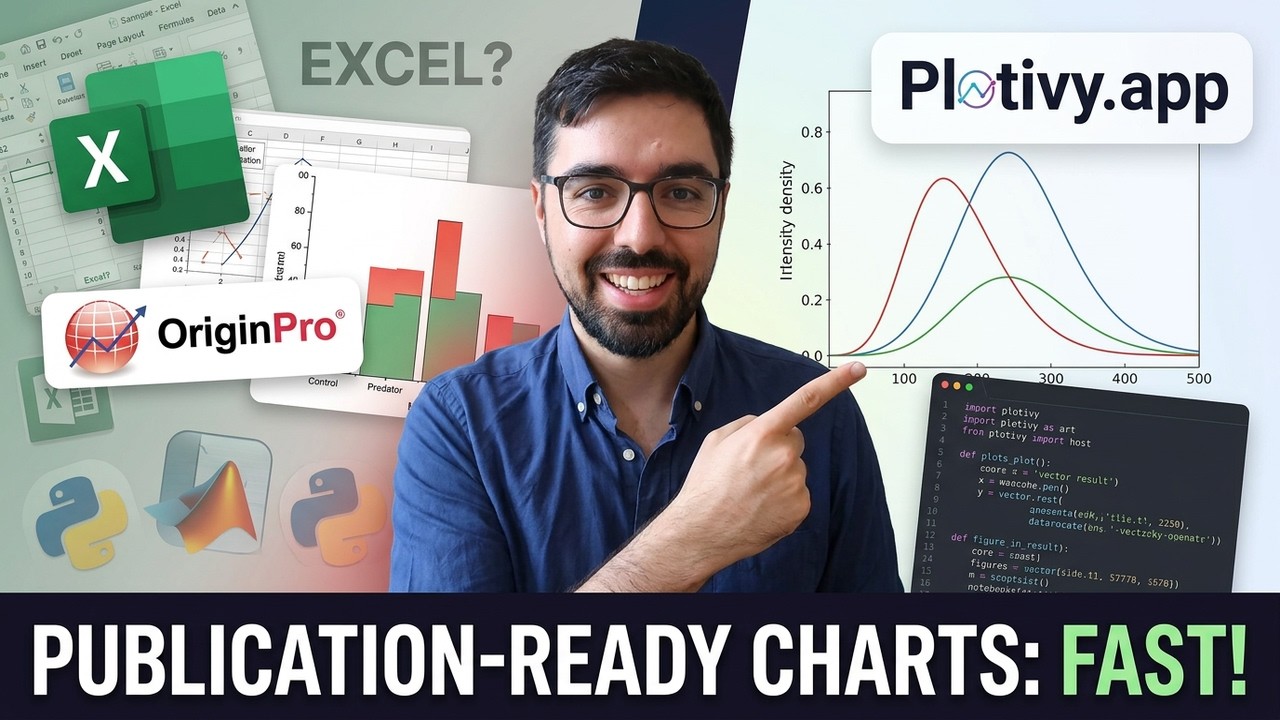
From Noise to Signal: Reproducible Photonics Data Analysis with Plotivy
A practical walkthrough of Plotivy's full research workflow. Covers why GUI tools like Origin and Excel leave your analysis undocumented, the difference between exploratory and explanatory data visualization, and a live demo performing FFT analysis on real white light reflective interferometry (WLRI) data to extract film thickness — all with AI-generated, fully auditable Python code. Also covers PNG vs PDF export and FAIR data principles for journal submission.
Talks & Pitches
Conference presentations and pitch videos
Click to play
Plotivy Pitch at OptecBB Photonics Days 2025
OptecBB Photonics Days 2025, Berlin
Pitch presentation given during the OptecBB Photonics Days event in Berlin, 2025. Learn about Plotivy's mission to revolutionize scientific data visualization.
Upcoming tutorial topics
More tutorials coming soon. The next useful topics are planned around figure cleanup, statistical annotations, spectroscopy analysis, and chart selection for common research datasets.