Featured Guide
January 15, 2025•12 min read
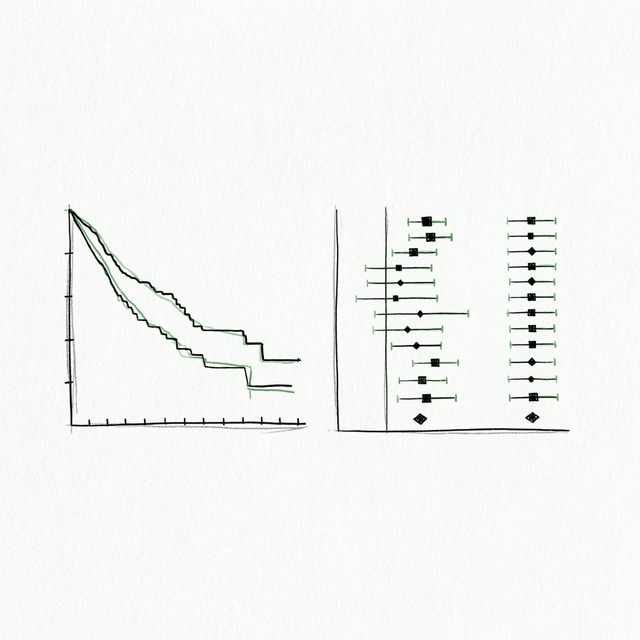
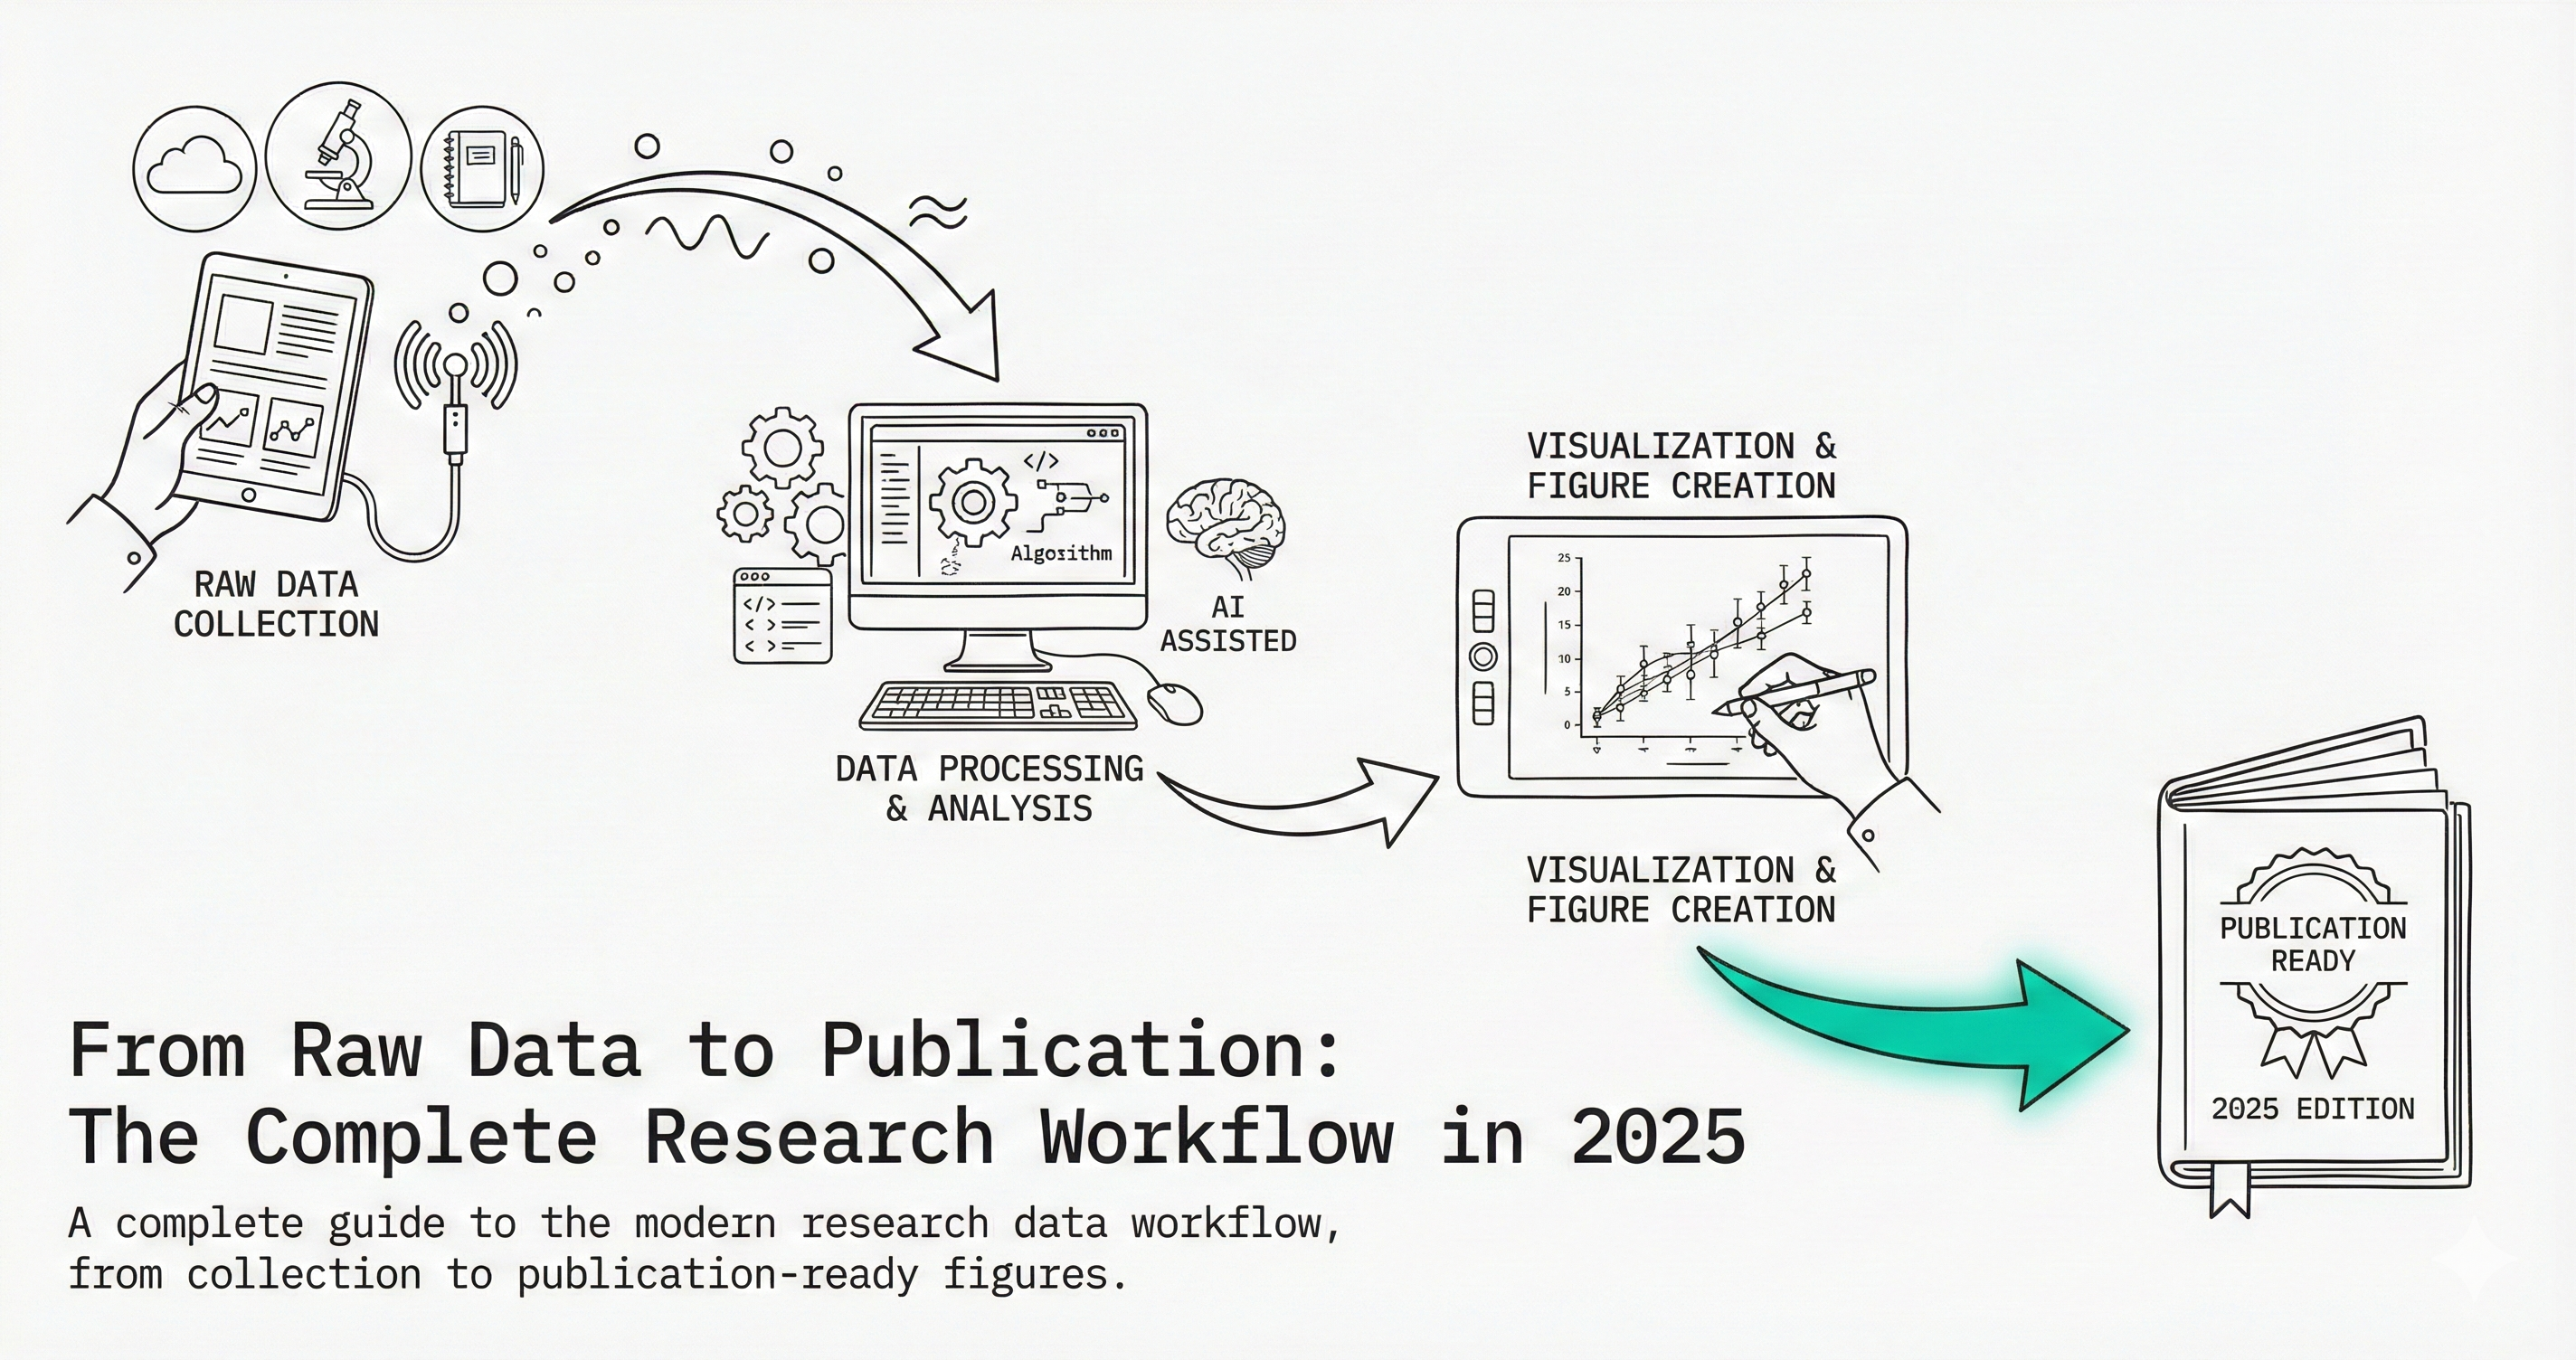
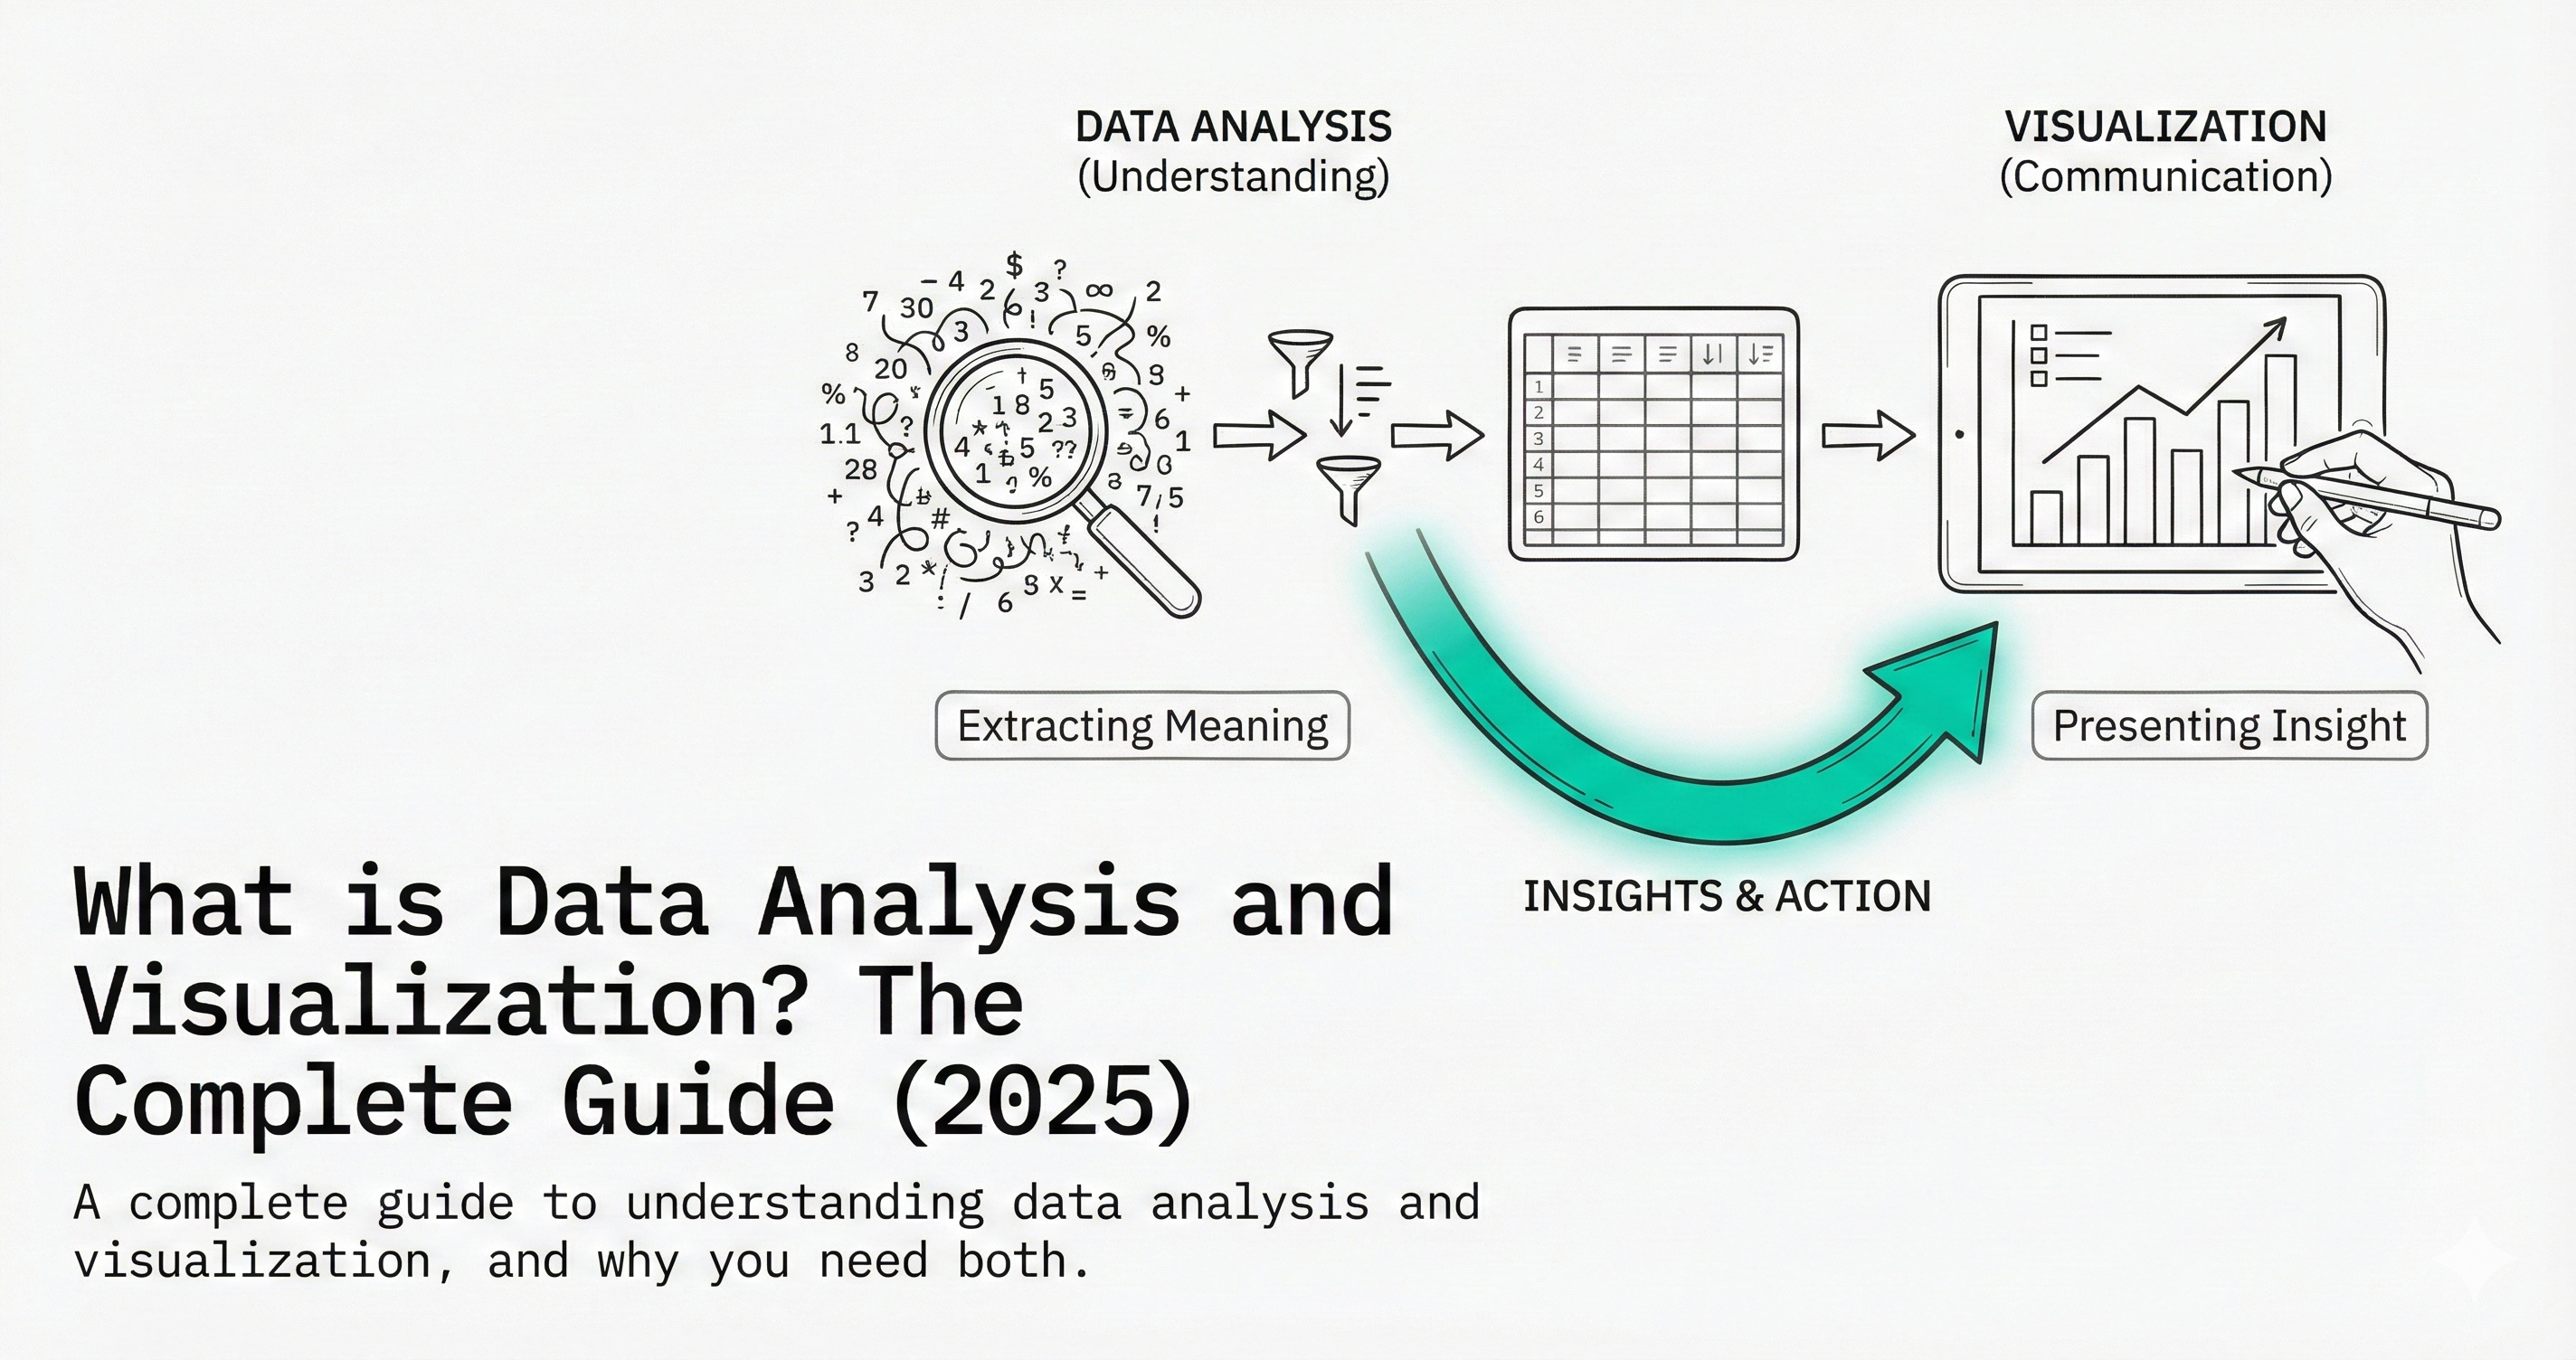
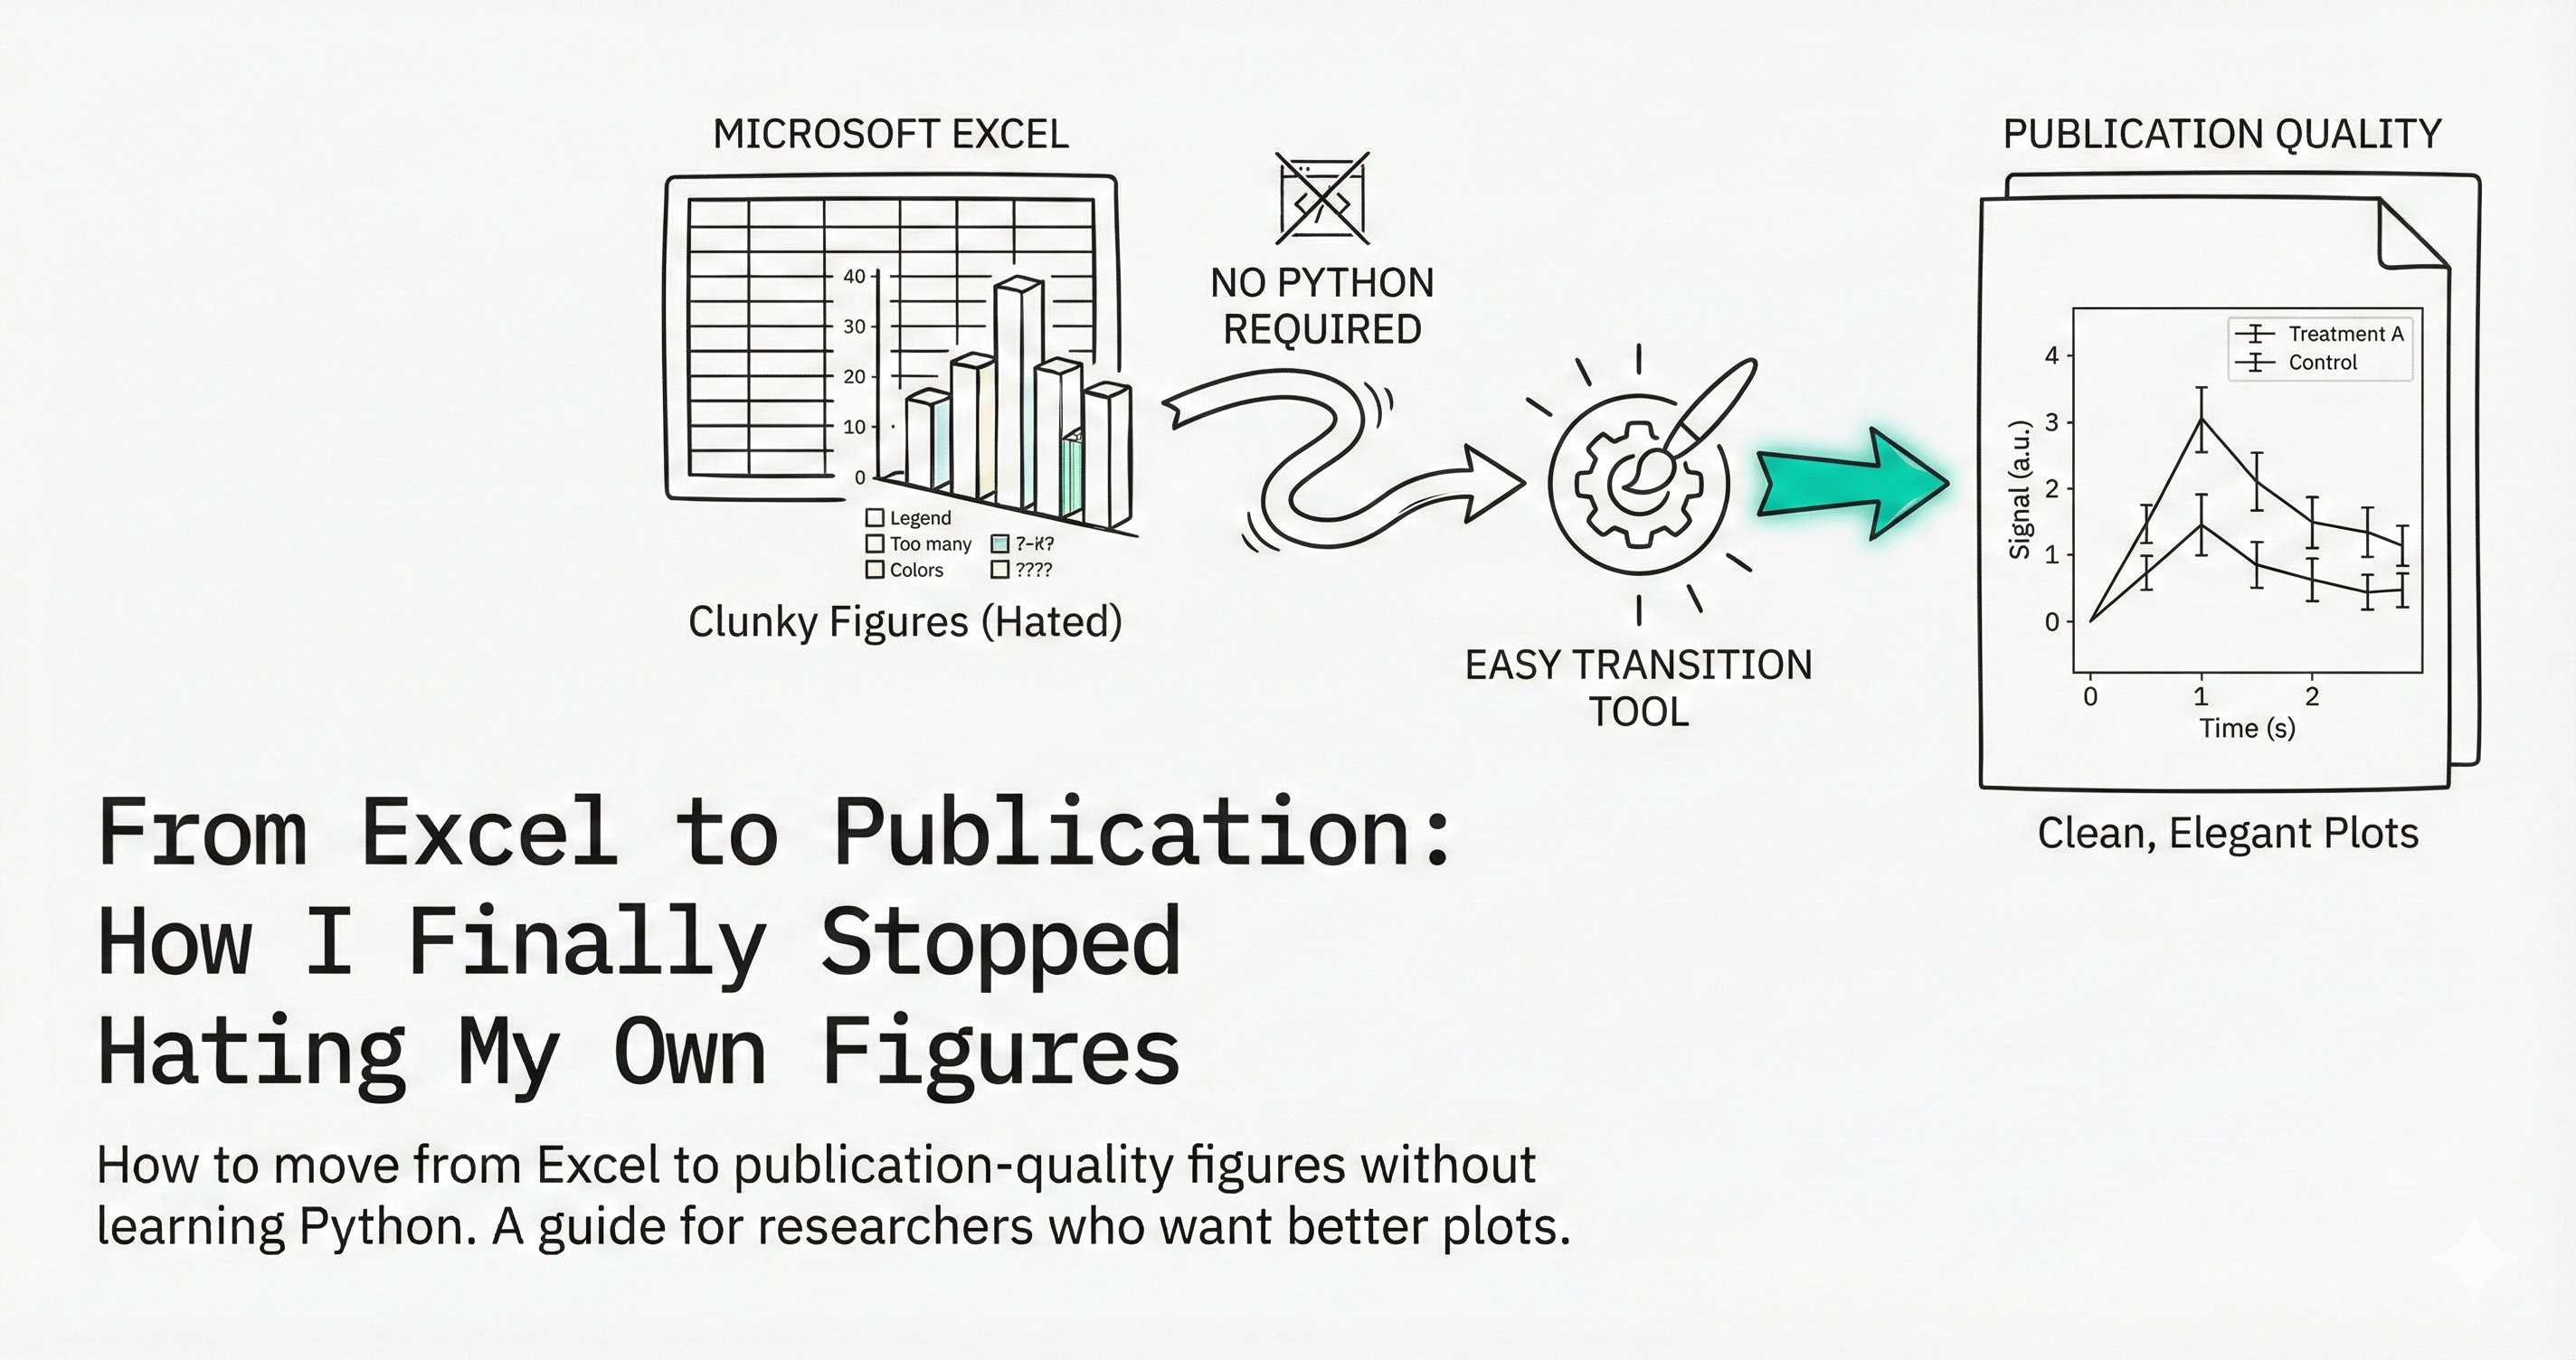
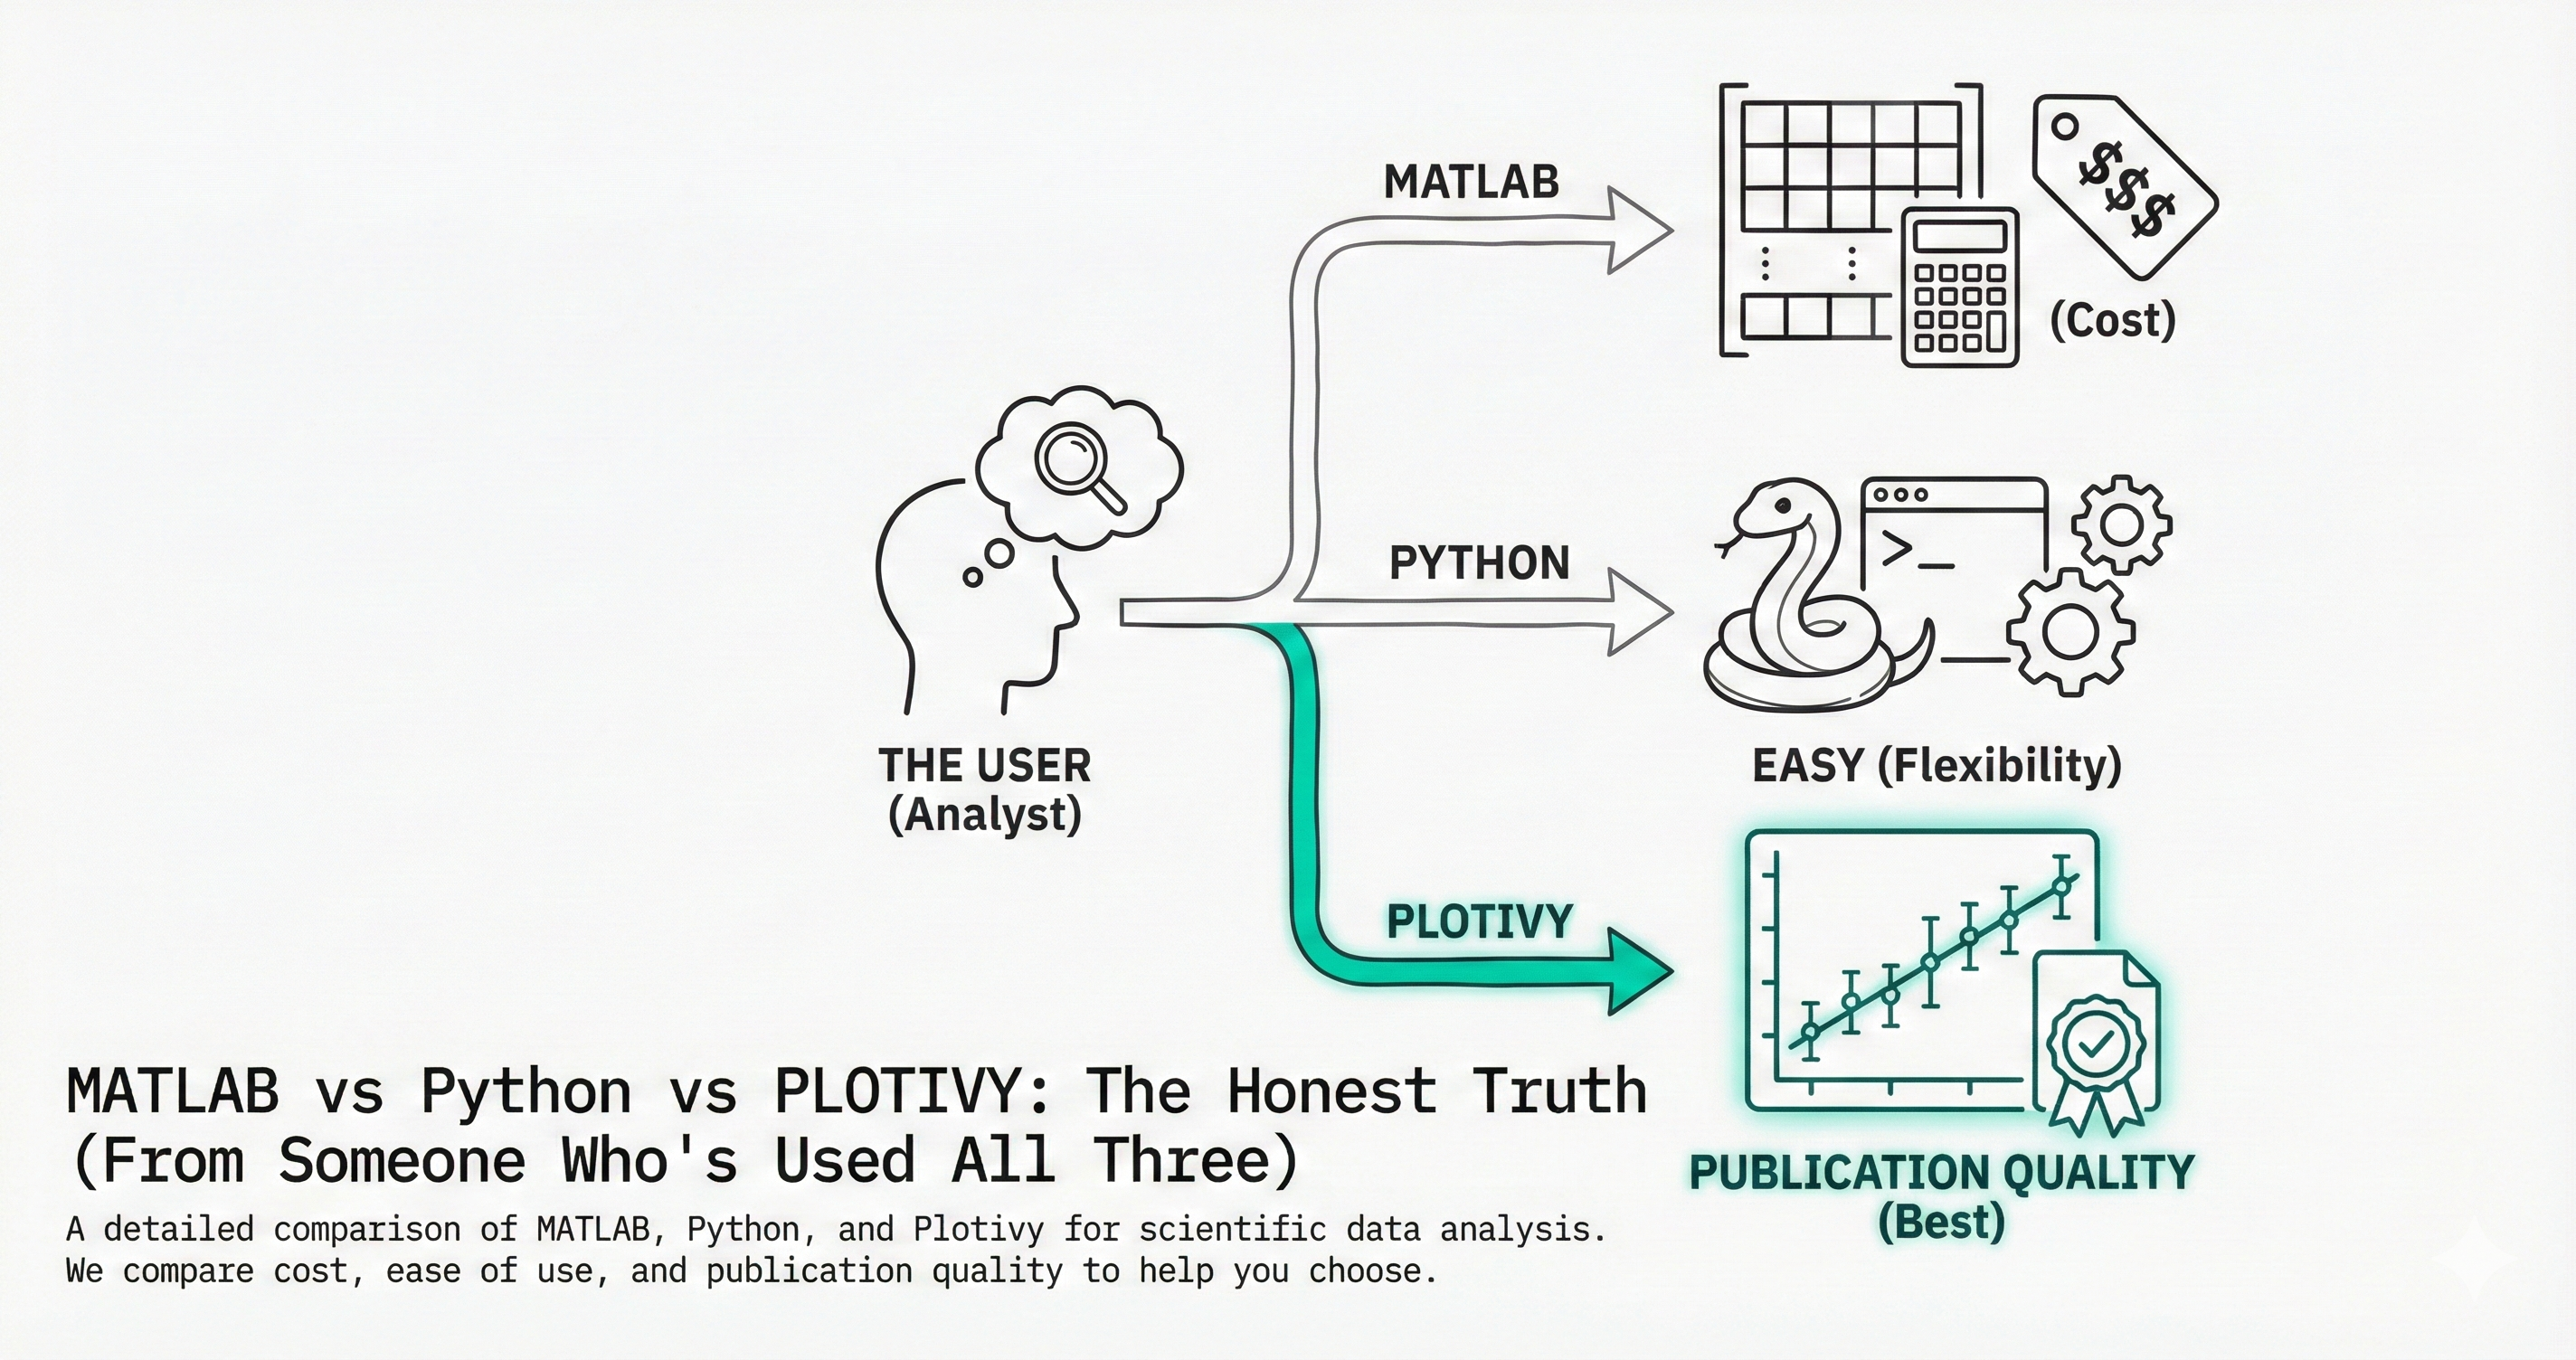
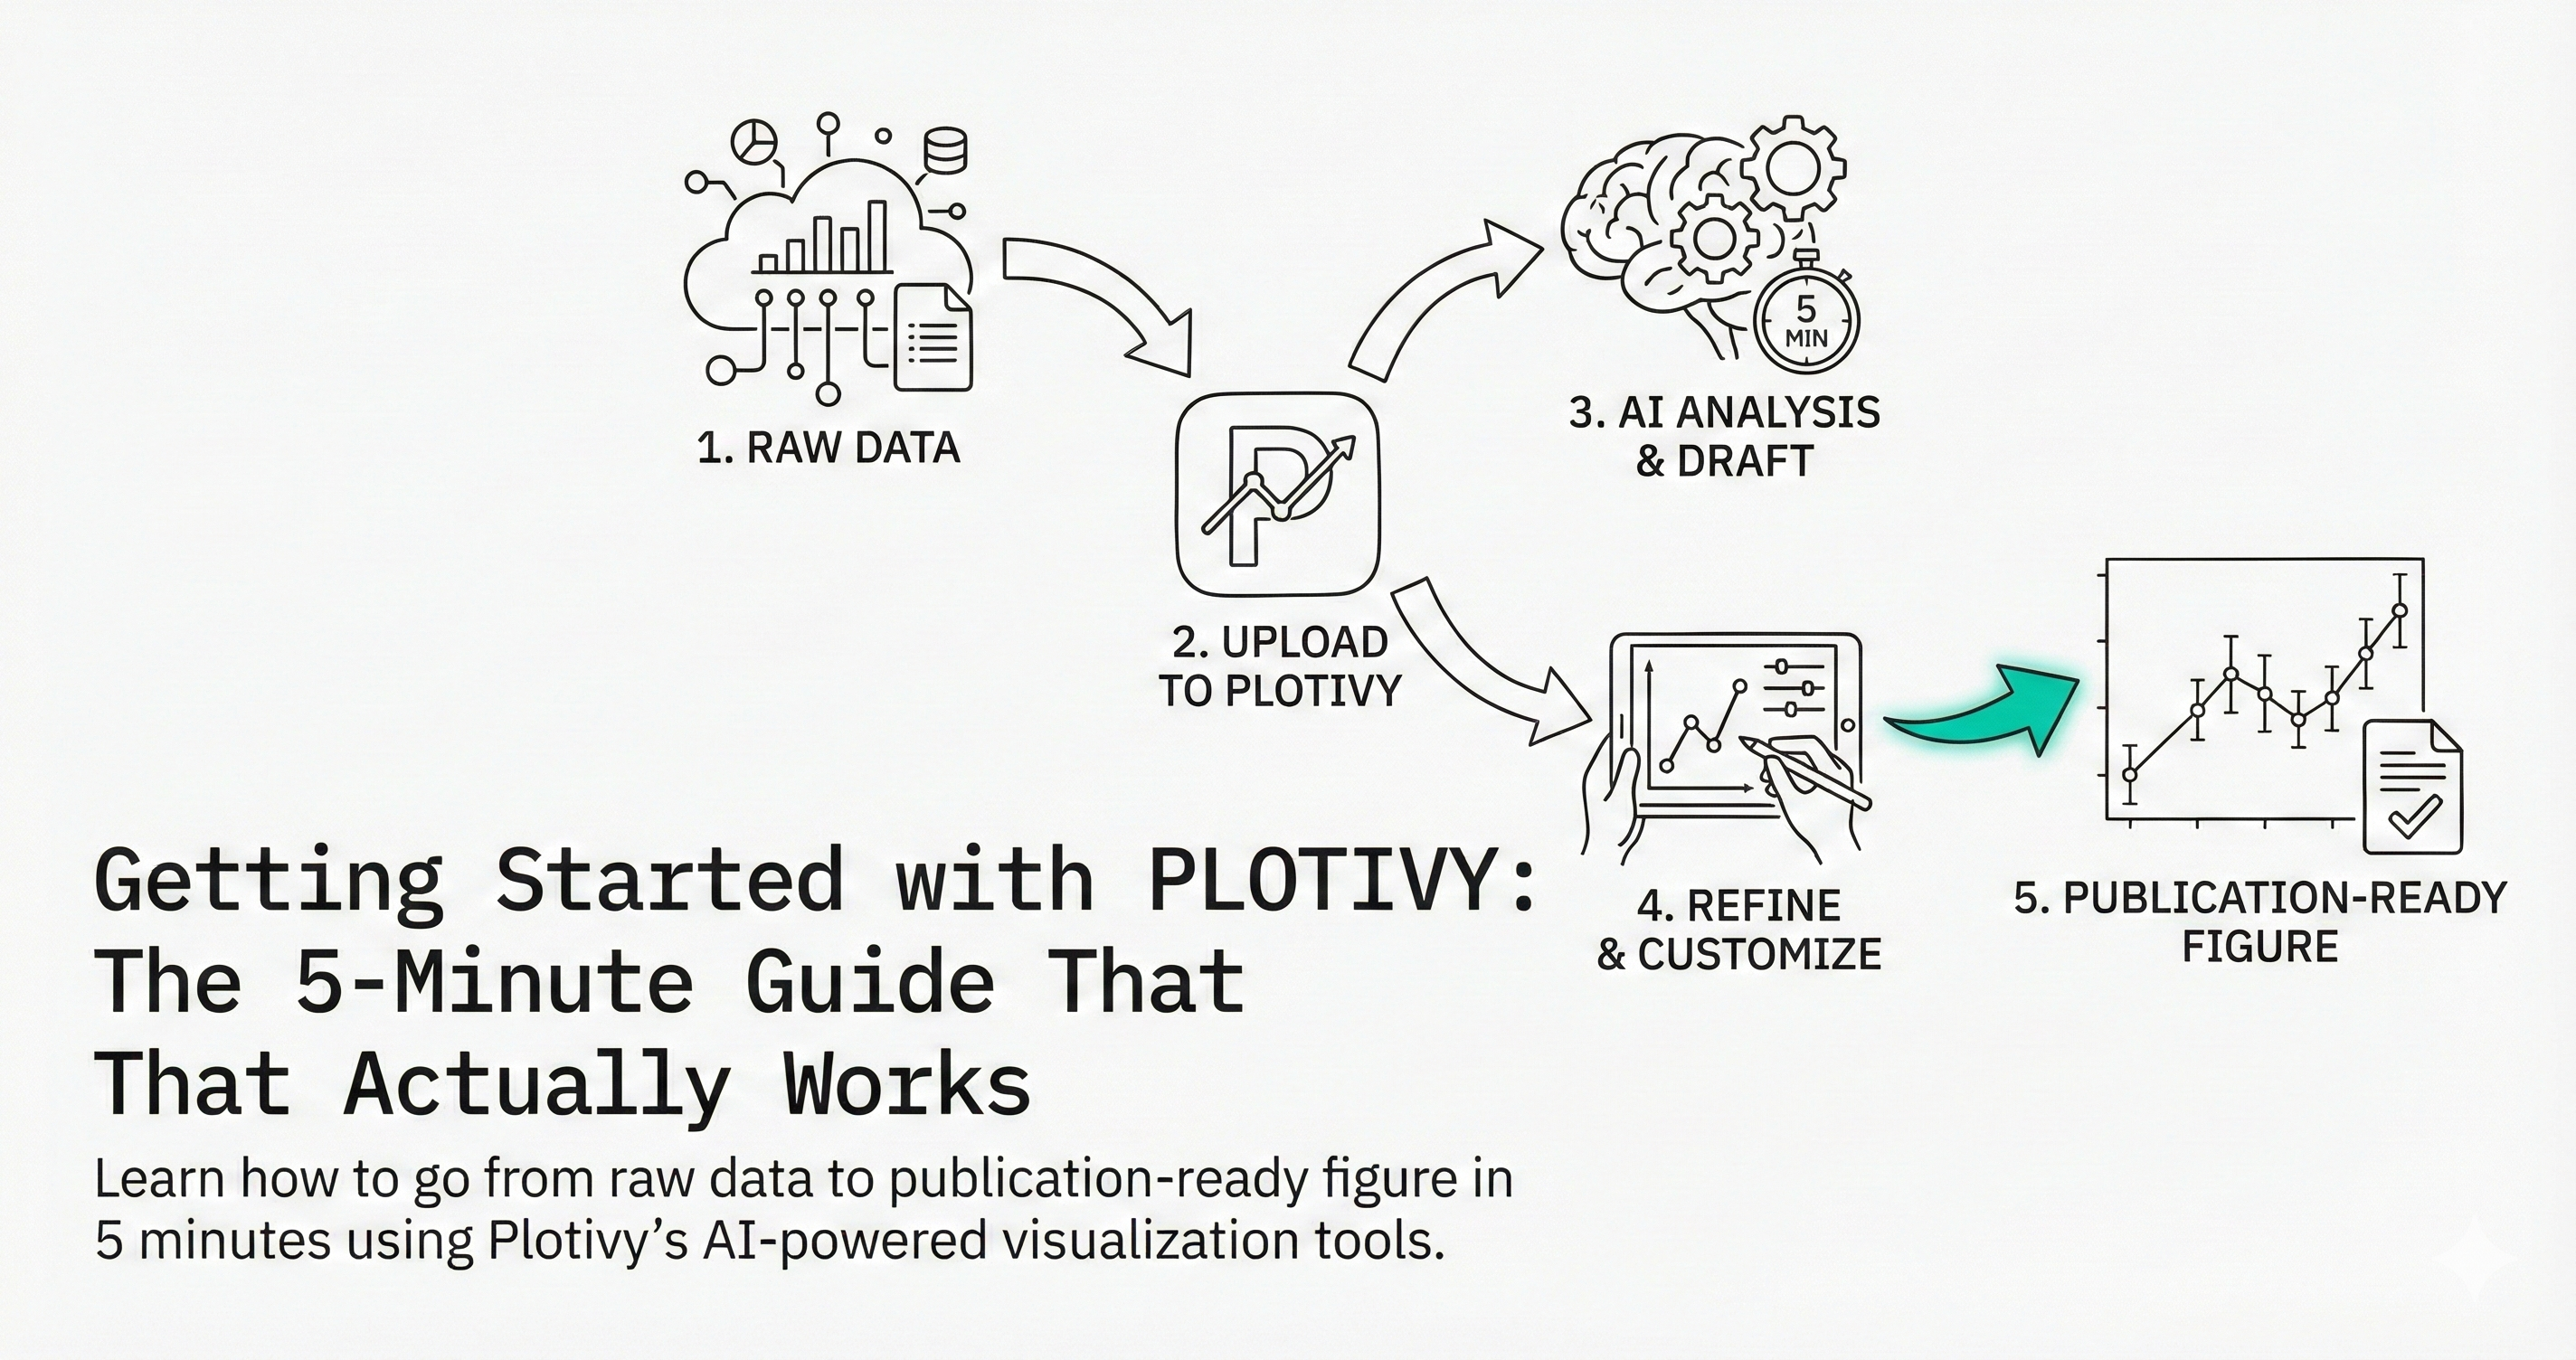
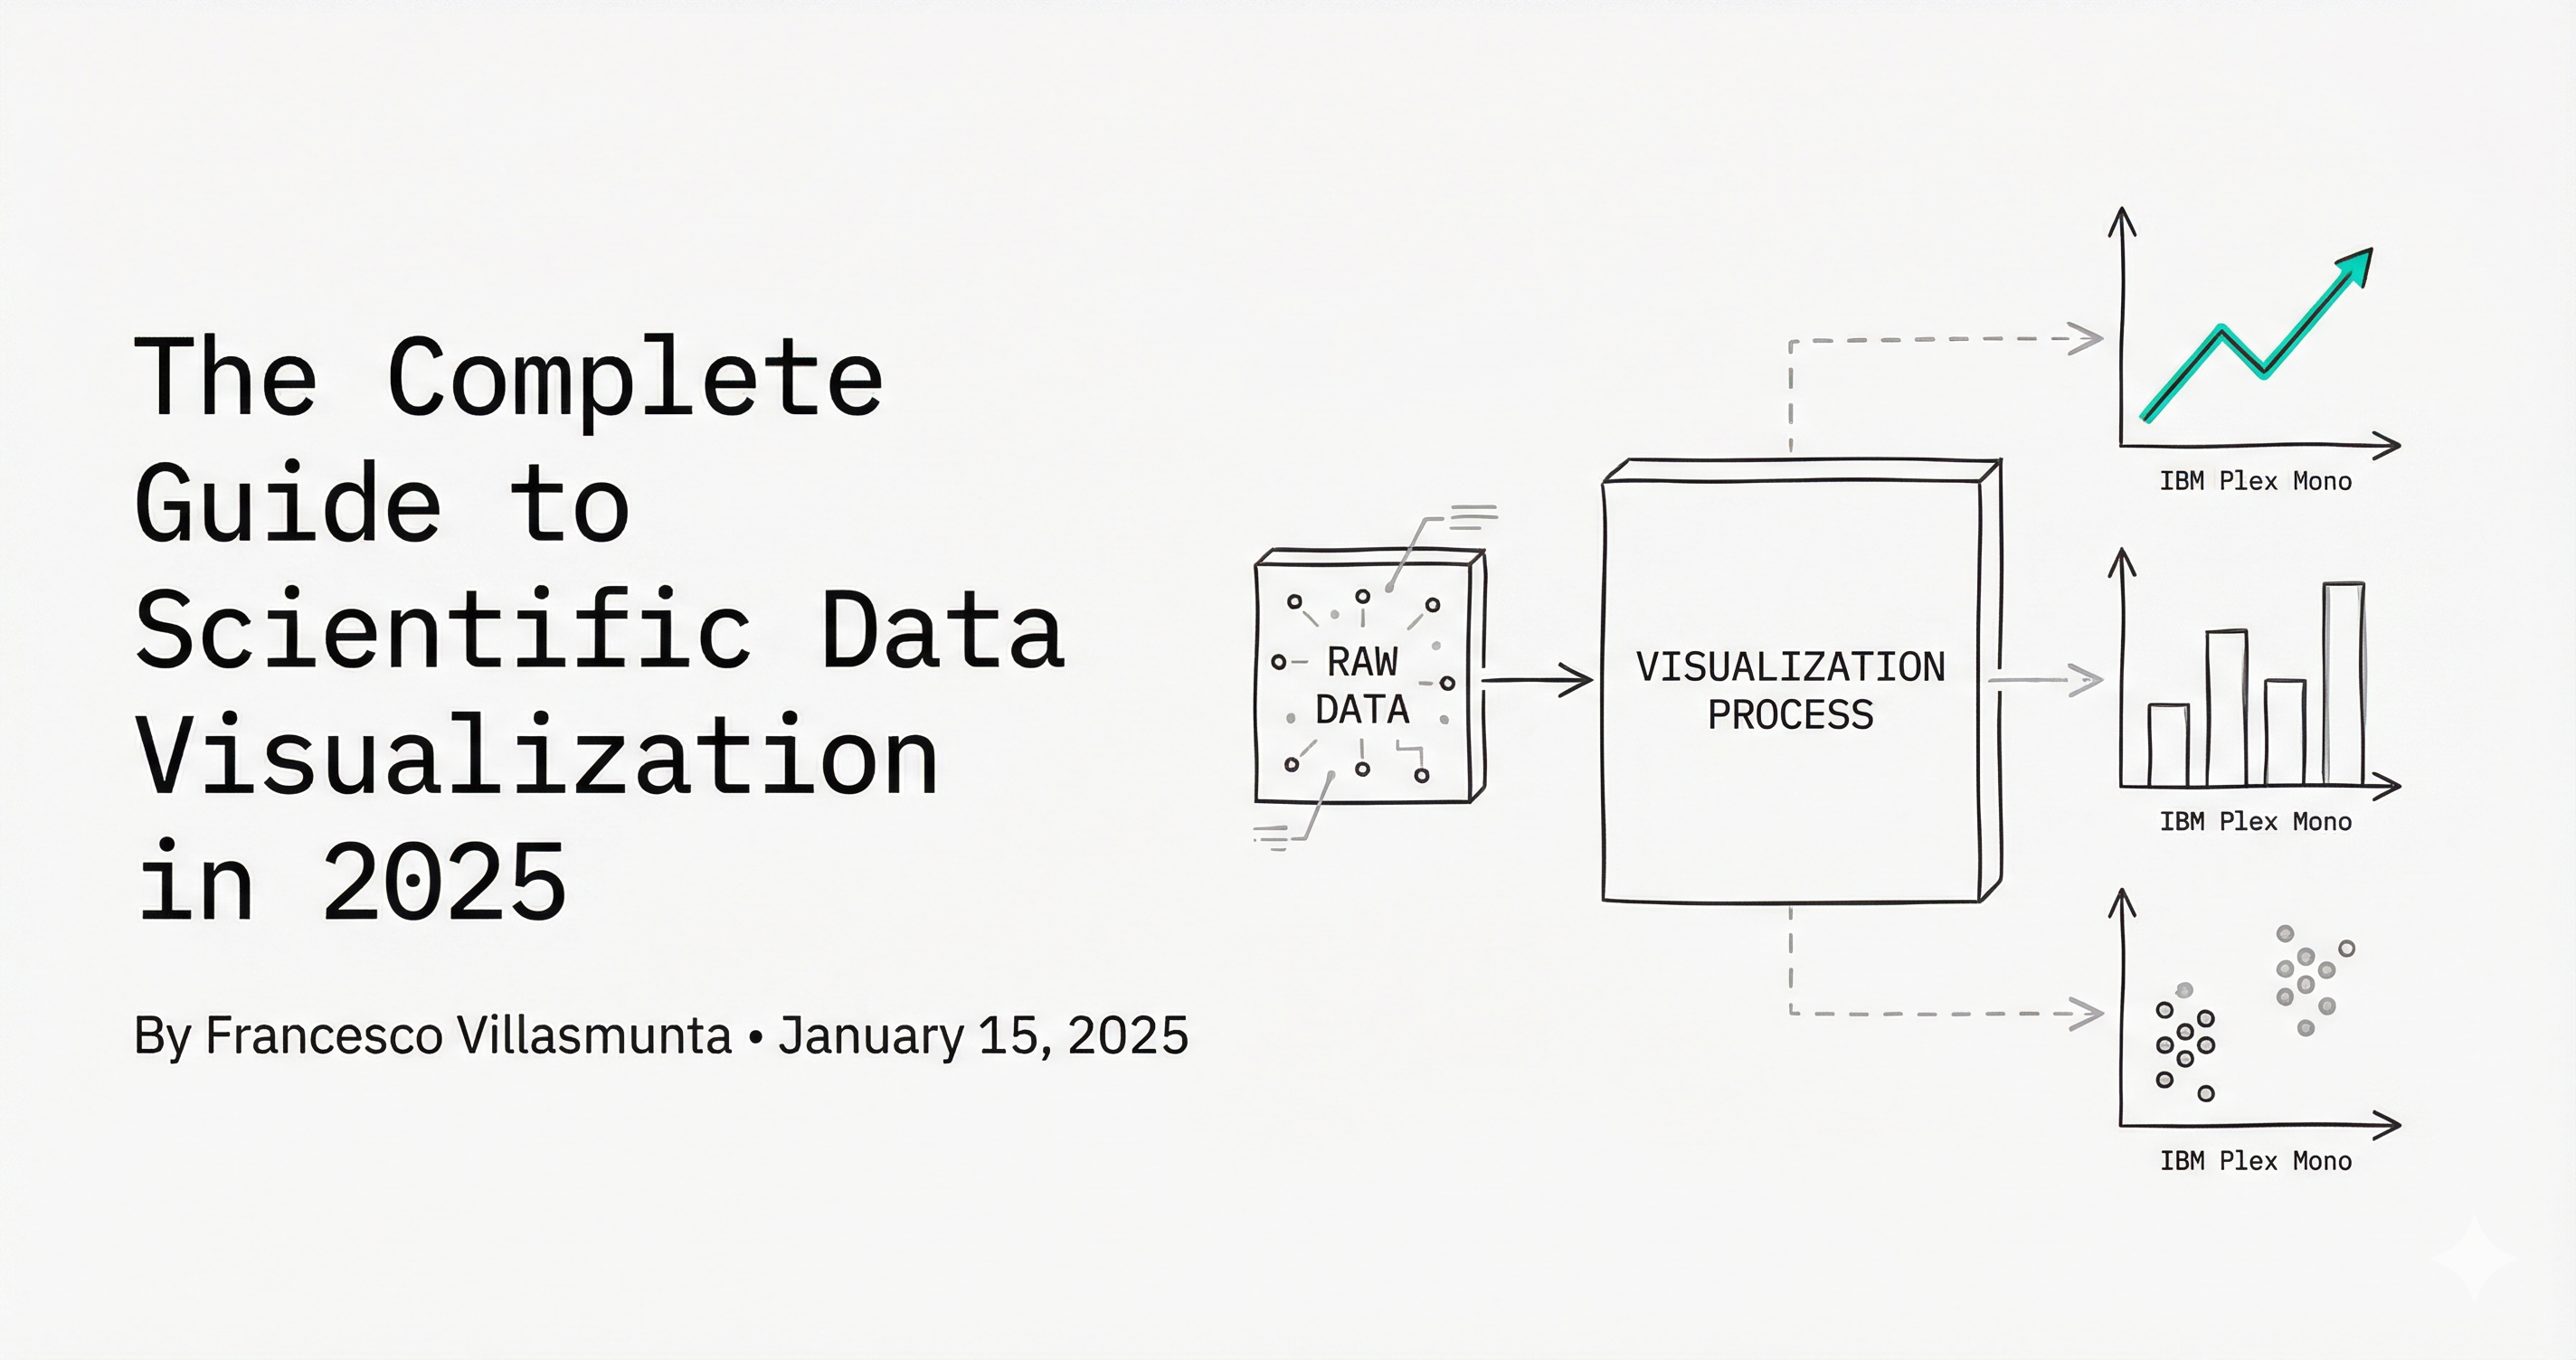
Scientific Data Visualization: The Complete Guide for Researchers (2026)
Master scientific data visualization with this complete guide. Learn best practices for publication-ready plots, choosing plot types, and how AI accelerates your research workflow.
#scientific data visualization#scientific data visualisation#scientific plotting#publication-ready plots