Menu
Refer a Friend
Share your link — earn +15 permanent plots for every friend who joins.
Sign in to get your referral linkmatplotlibbar
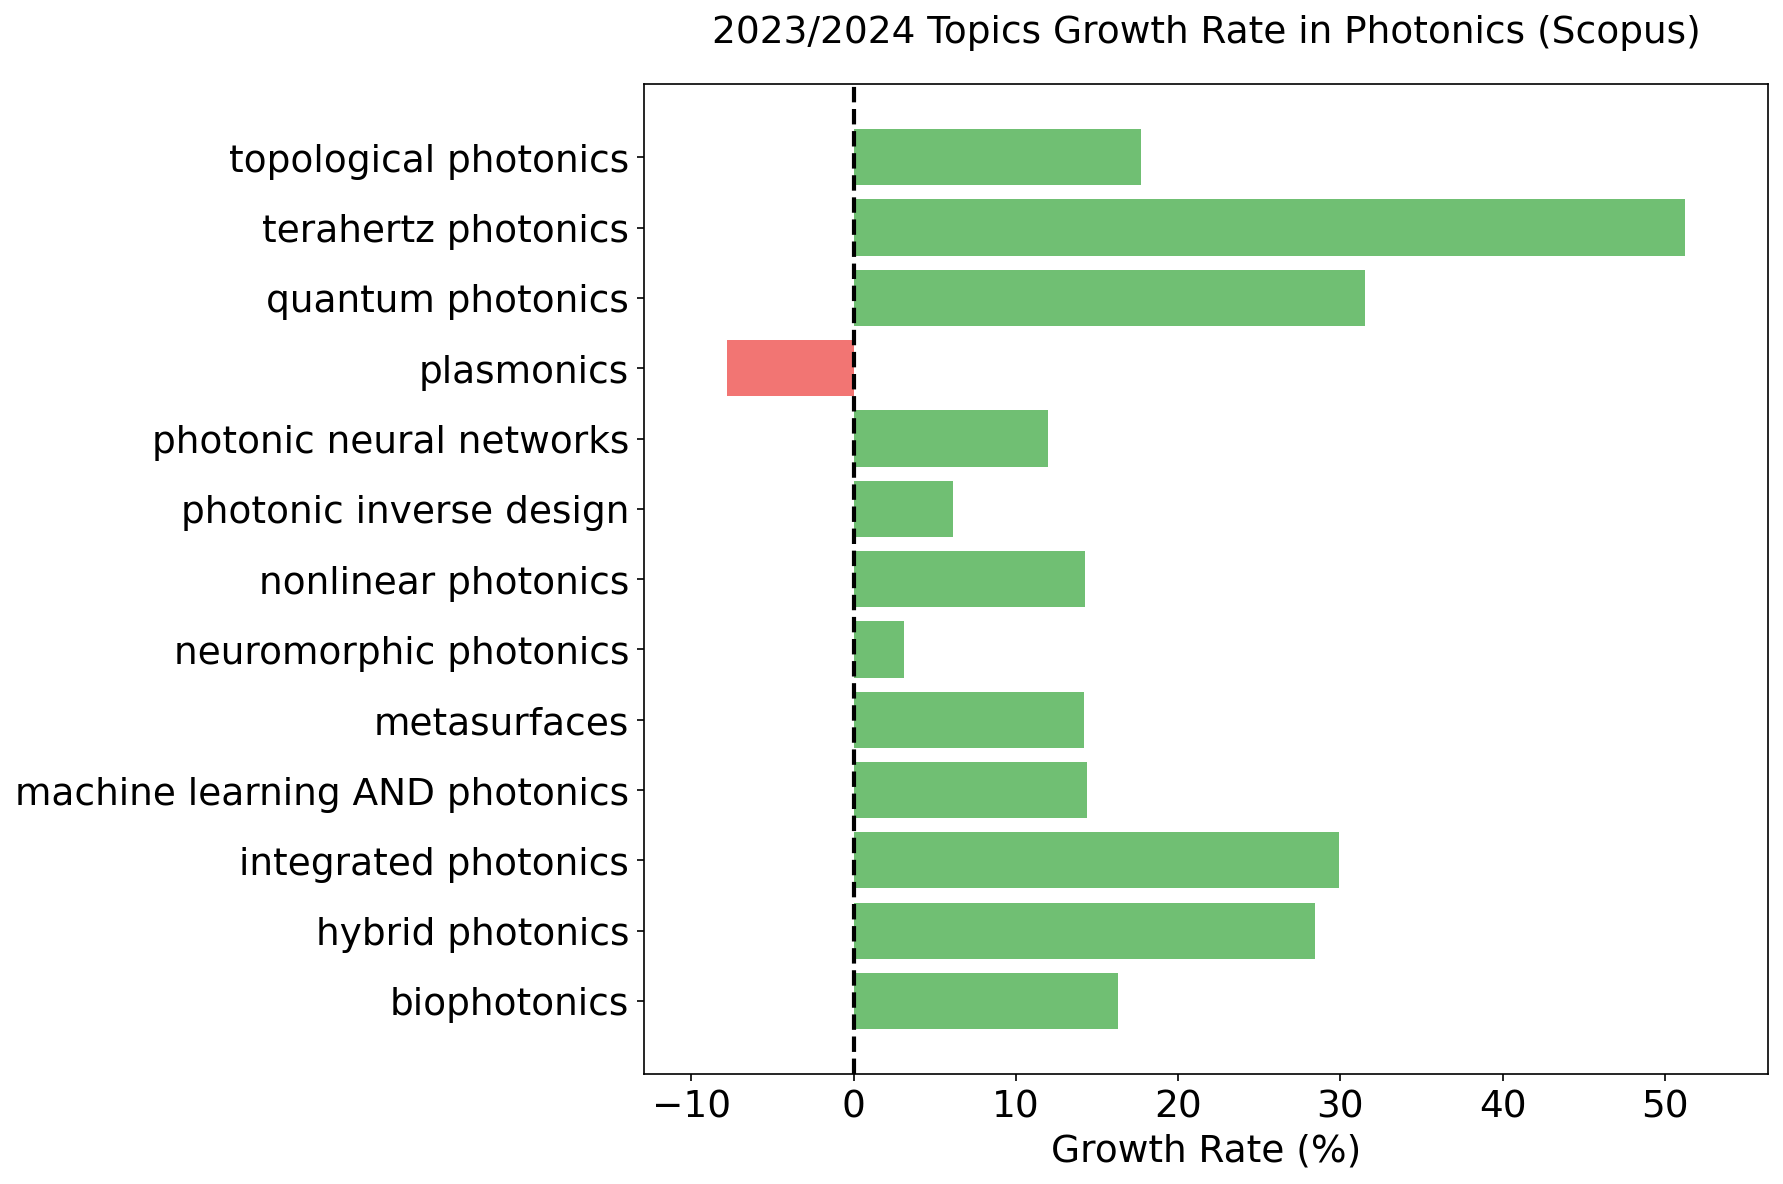
Bar plot showing the growth rates (%) of photonics topics in 2023/2024, derived from Scopus-indexed publications. Each segment represents a grouped topic, illustrating relative contributions to overall topic expansion in the field.
Description
The script queries Scopus by building flexible TITLE-ABS-KEY clauses for each photonics topic, incorporating exact phrases, hyphenated variants, proximity searches (words within 3 positions), and plural forms to catch variations like "photonic inverse design" or "inverse-designed". It adds subject area filters (physics, engineering, materials, biology, medicine) and publication year to narrow results. For each topic and year from 2000-2024, it makes an API call to Scopus using the provided key, retrieves the total paper count,
0
Creator
anonymous
Published
October 23, 2025
More sharing options
More like this
Similar plots from the gallery.