Menu
Refer a Friend
Share your link — earn +15 permanent plots for every friend who joins.
Sign in to get your referral linkmatplotlibbar
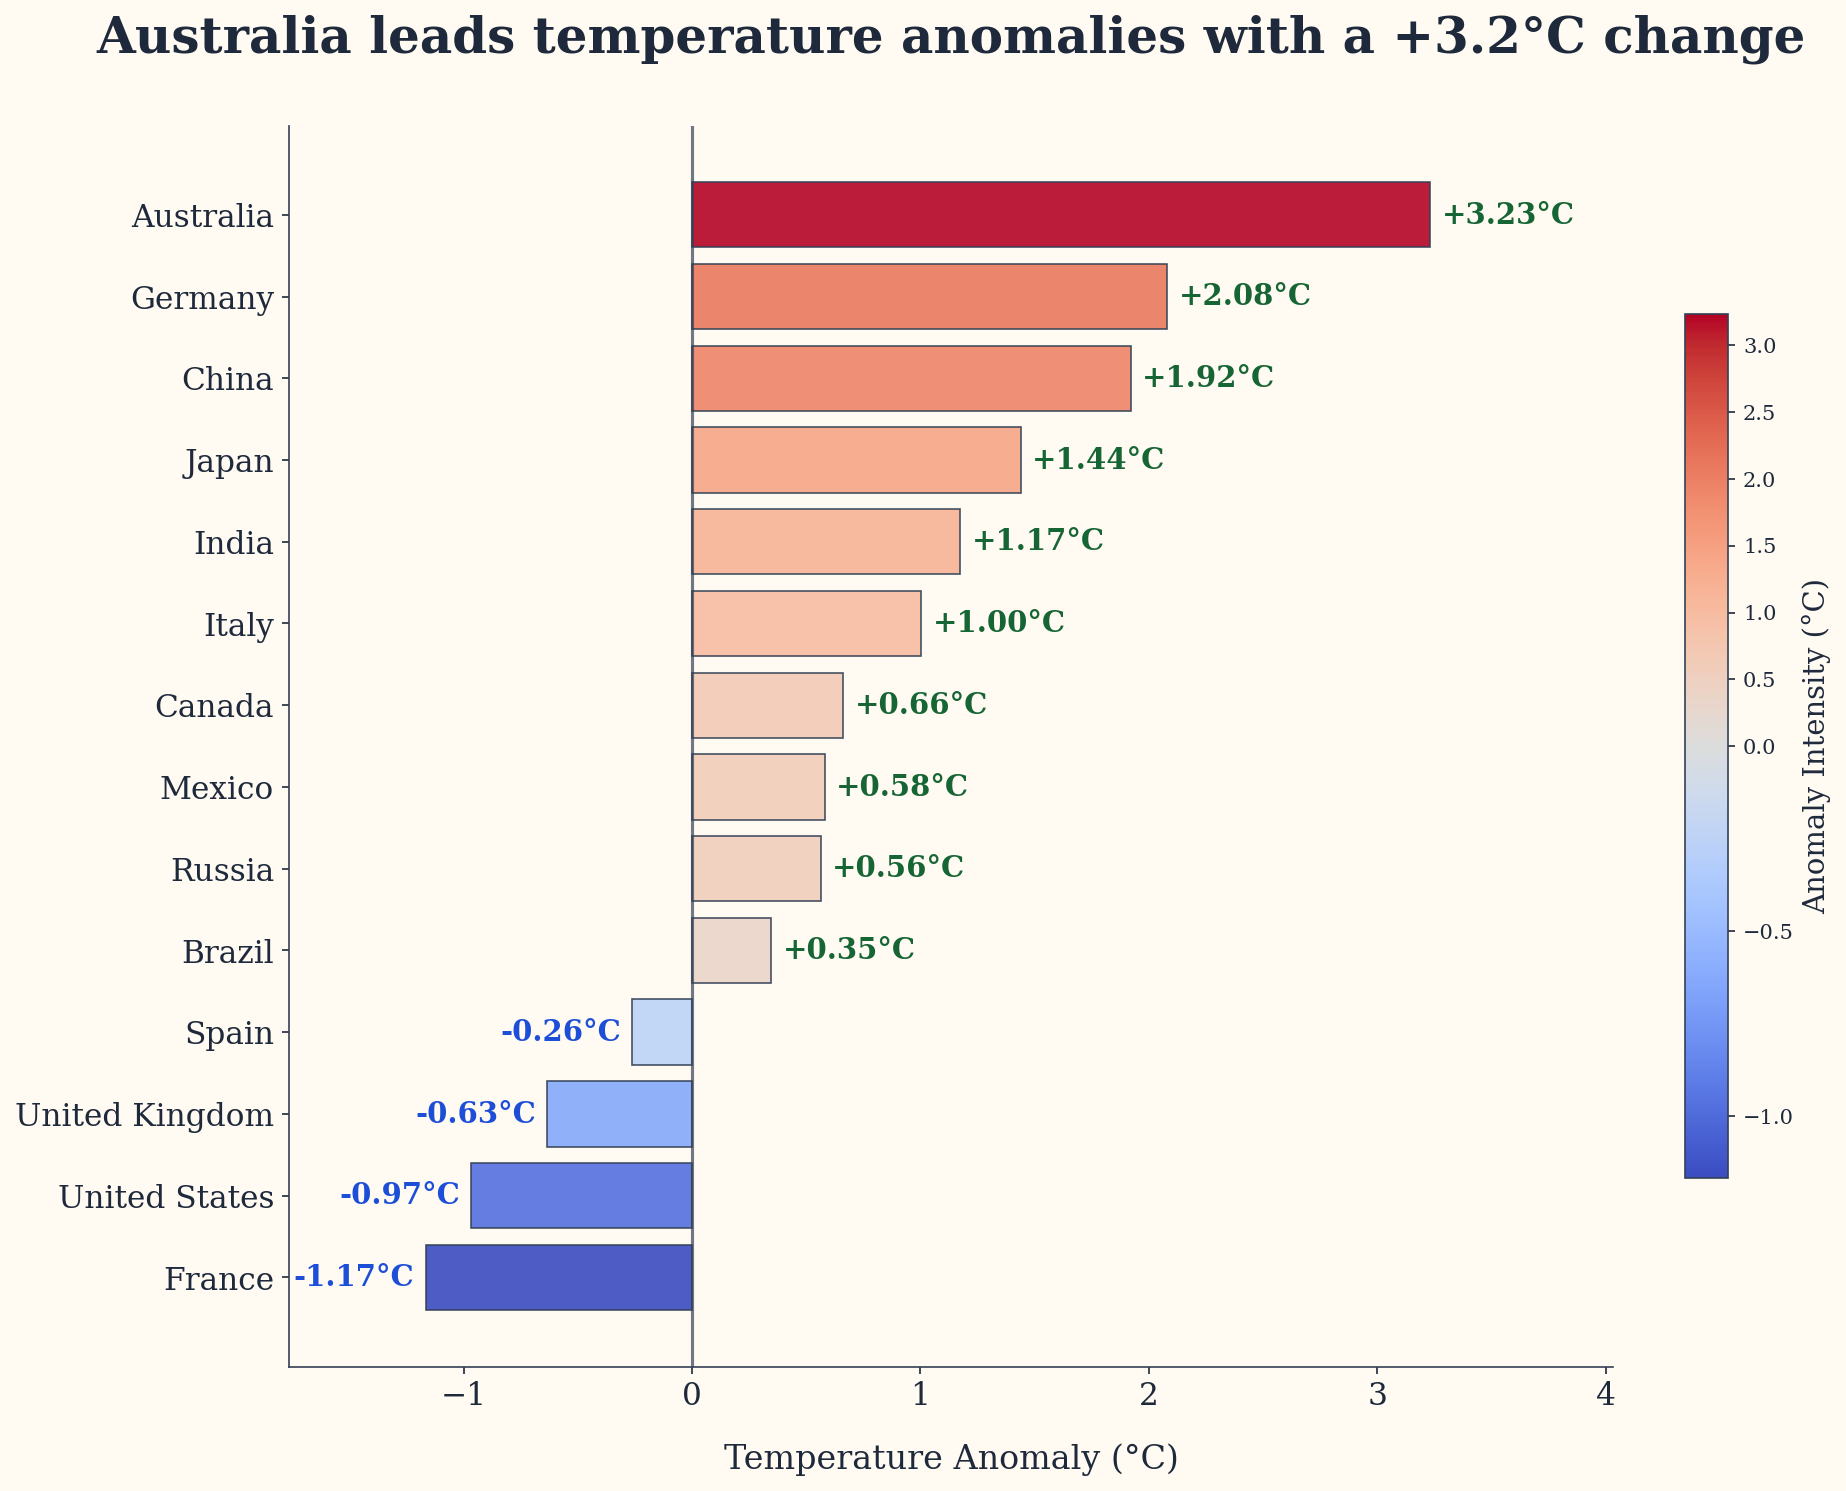
Comparison of temperature anomalies across selected countries
Description
Comparison of temperature anomalies across selected countries, utilizing a diverging color scale to distinguish between warming and cooling trends relative to a zero-degree baseline. The visualization highlights regional climatic variability, specifically identifying the countries with the most pronounced positive and negative temperature shifts. These data illustrate the non-uniform distribution of thermal changes across different geographic locations.
Tags
#code#data available#bar
0
Creator
85575894-8803-4260-9370-289a4b586346
Published
March 22, 2026
More sharing options
More like this
Similar plots from the gallery.
