Menu
Refer a Friend
Share your link — earn +15 permanent plots for every friend who joins.
Sign in to get your referral linkComprehensive spectroscopic dashboard
Description
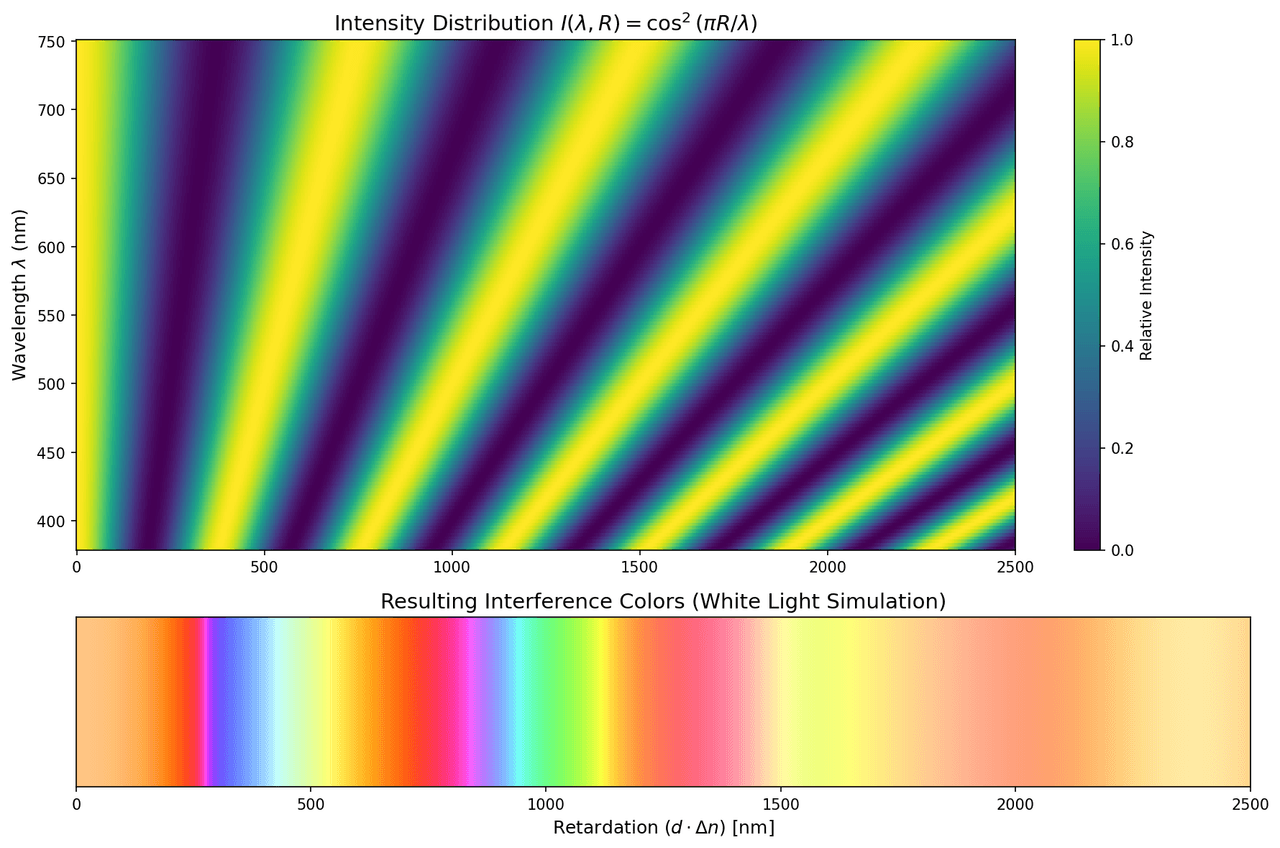
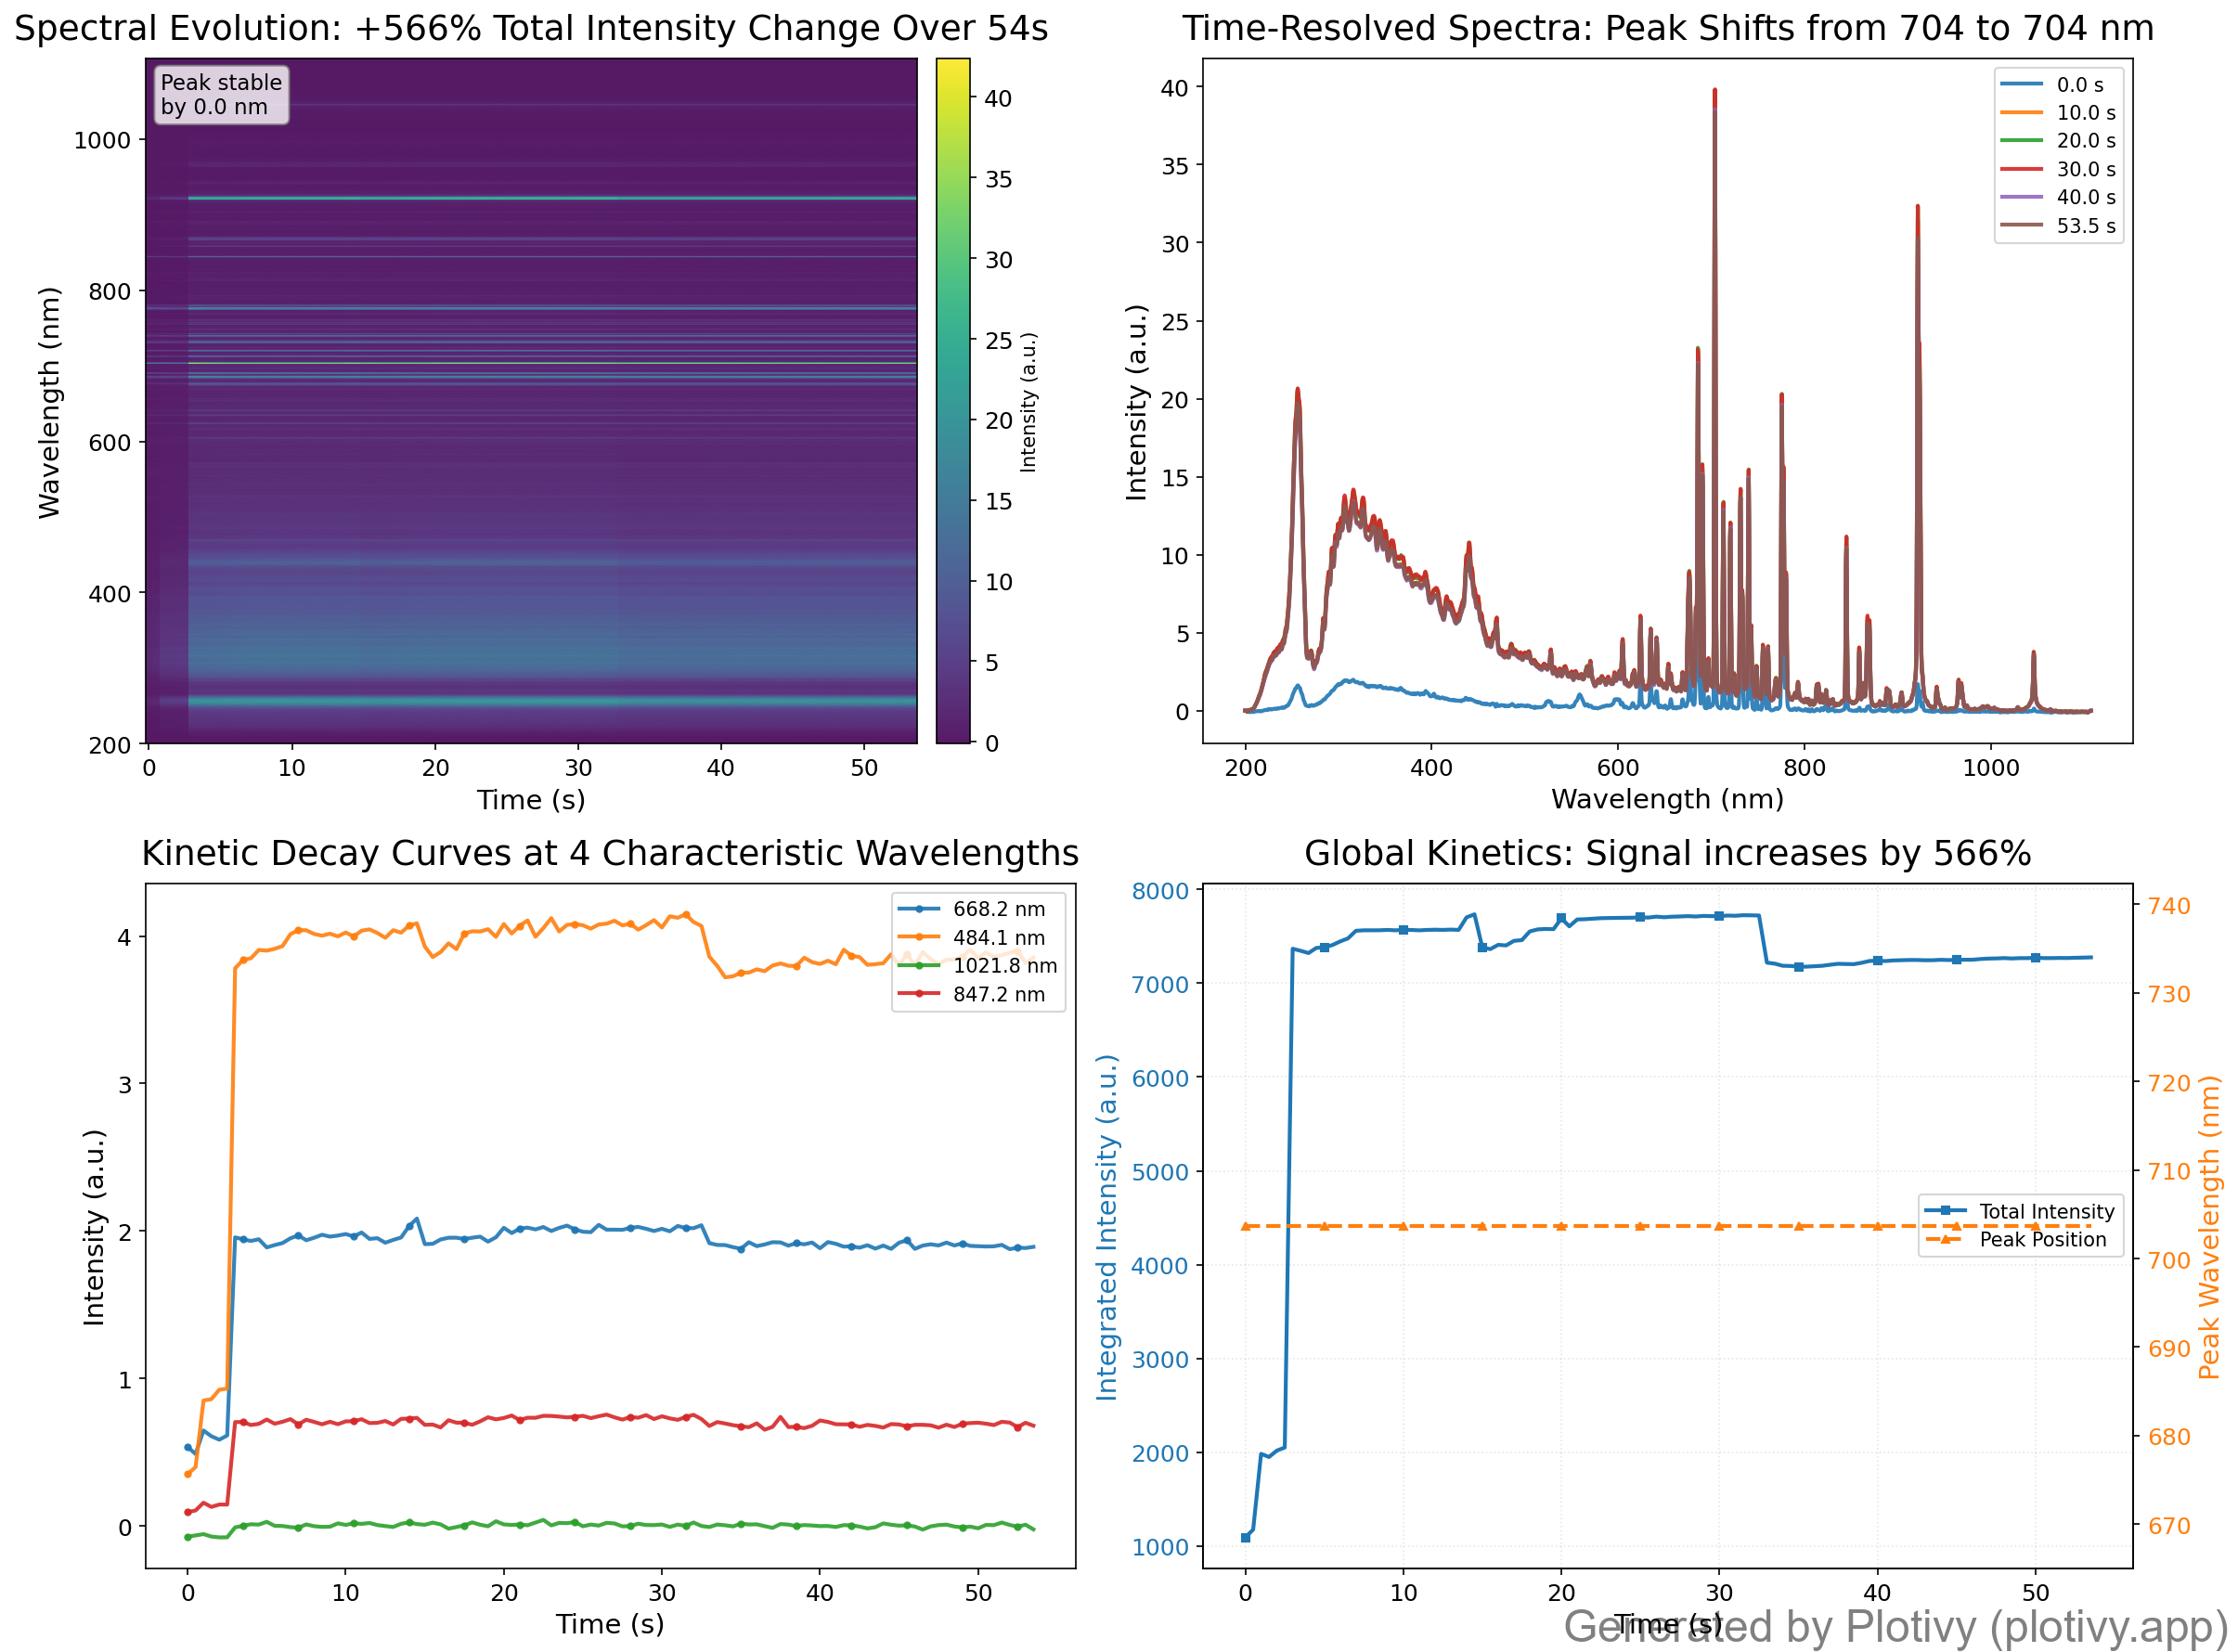
Comprehensive spectroscopic dashboard capturing the temporal evolution of optical spectra over a 53.5-second measurement window. The four-panel layout presents (top left) a wavelength-time heatmap of intensity distribution, (top right) time-resolved spectra at selected intervals highlighting peak shifts, (bottom left) kinetic decay curves at characteristic wavelengths, and (bottom right) dual-axis tracking of integrated intensity and peak position trajectories. These complementary views enable quantitative analysis of spectral dynamics, revealing the magnitude and direction of peak wavelength shifts alongside global intensity changes throughout the reaction progression.
Tags
Creator
85575894-8803-4260-9370-289a4b586346
Published
February 8, 2026
More sharing options
More like this
Similar plots from the gallery.