Menu
Refer a Friend
Share your link — earn +15 permanent plots for every friend who joins.
Sign in to get your referral linkmatplotlibother
Hierarchical bubble chart
Description
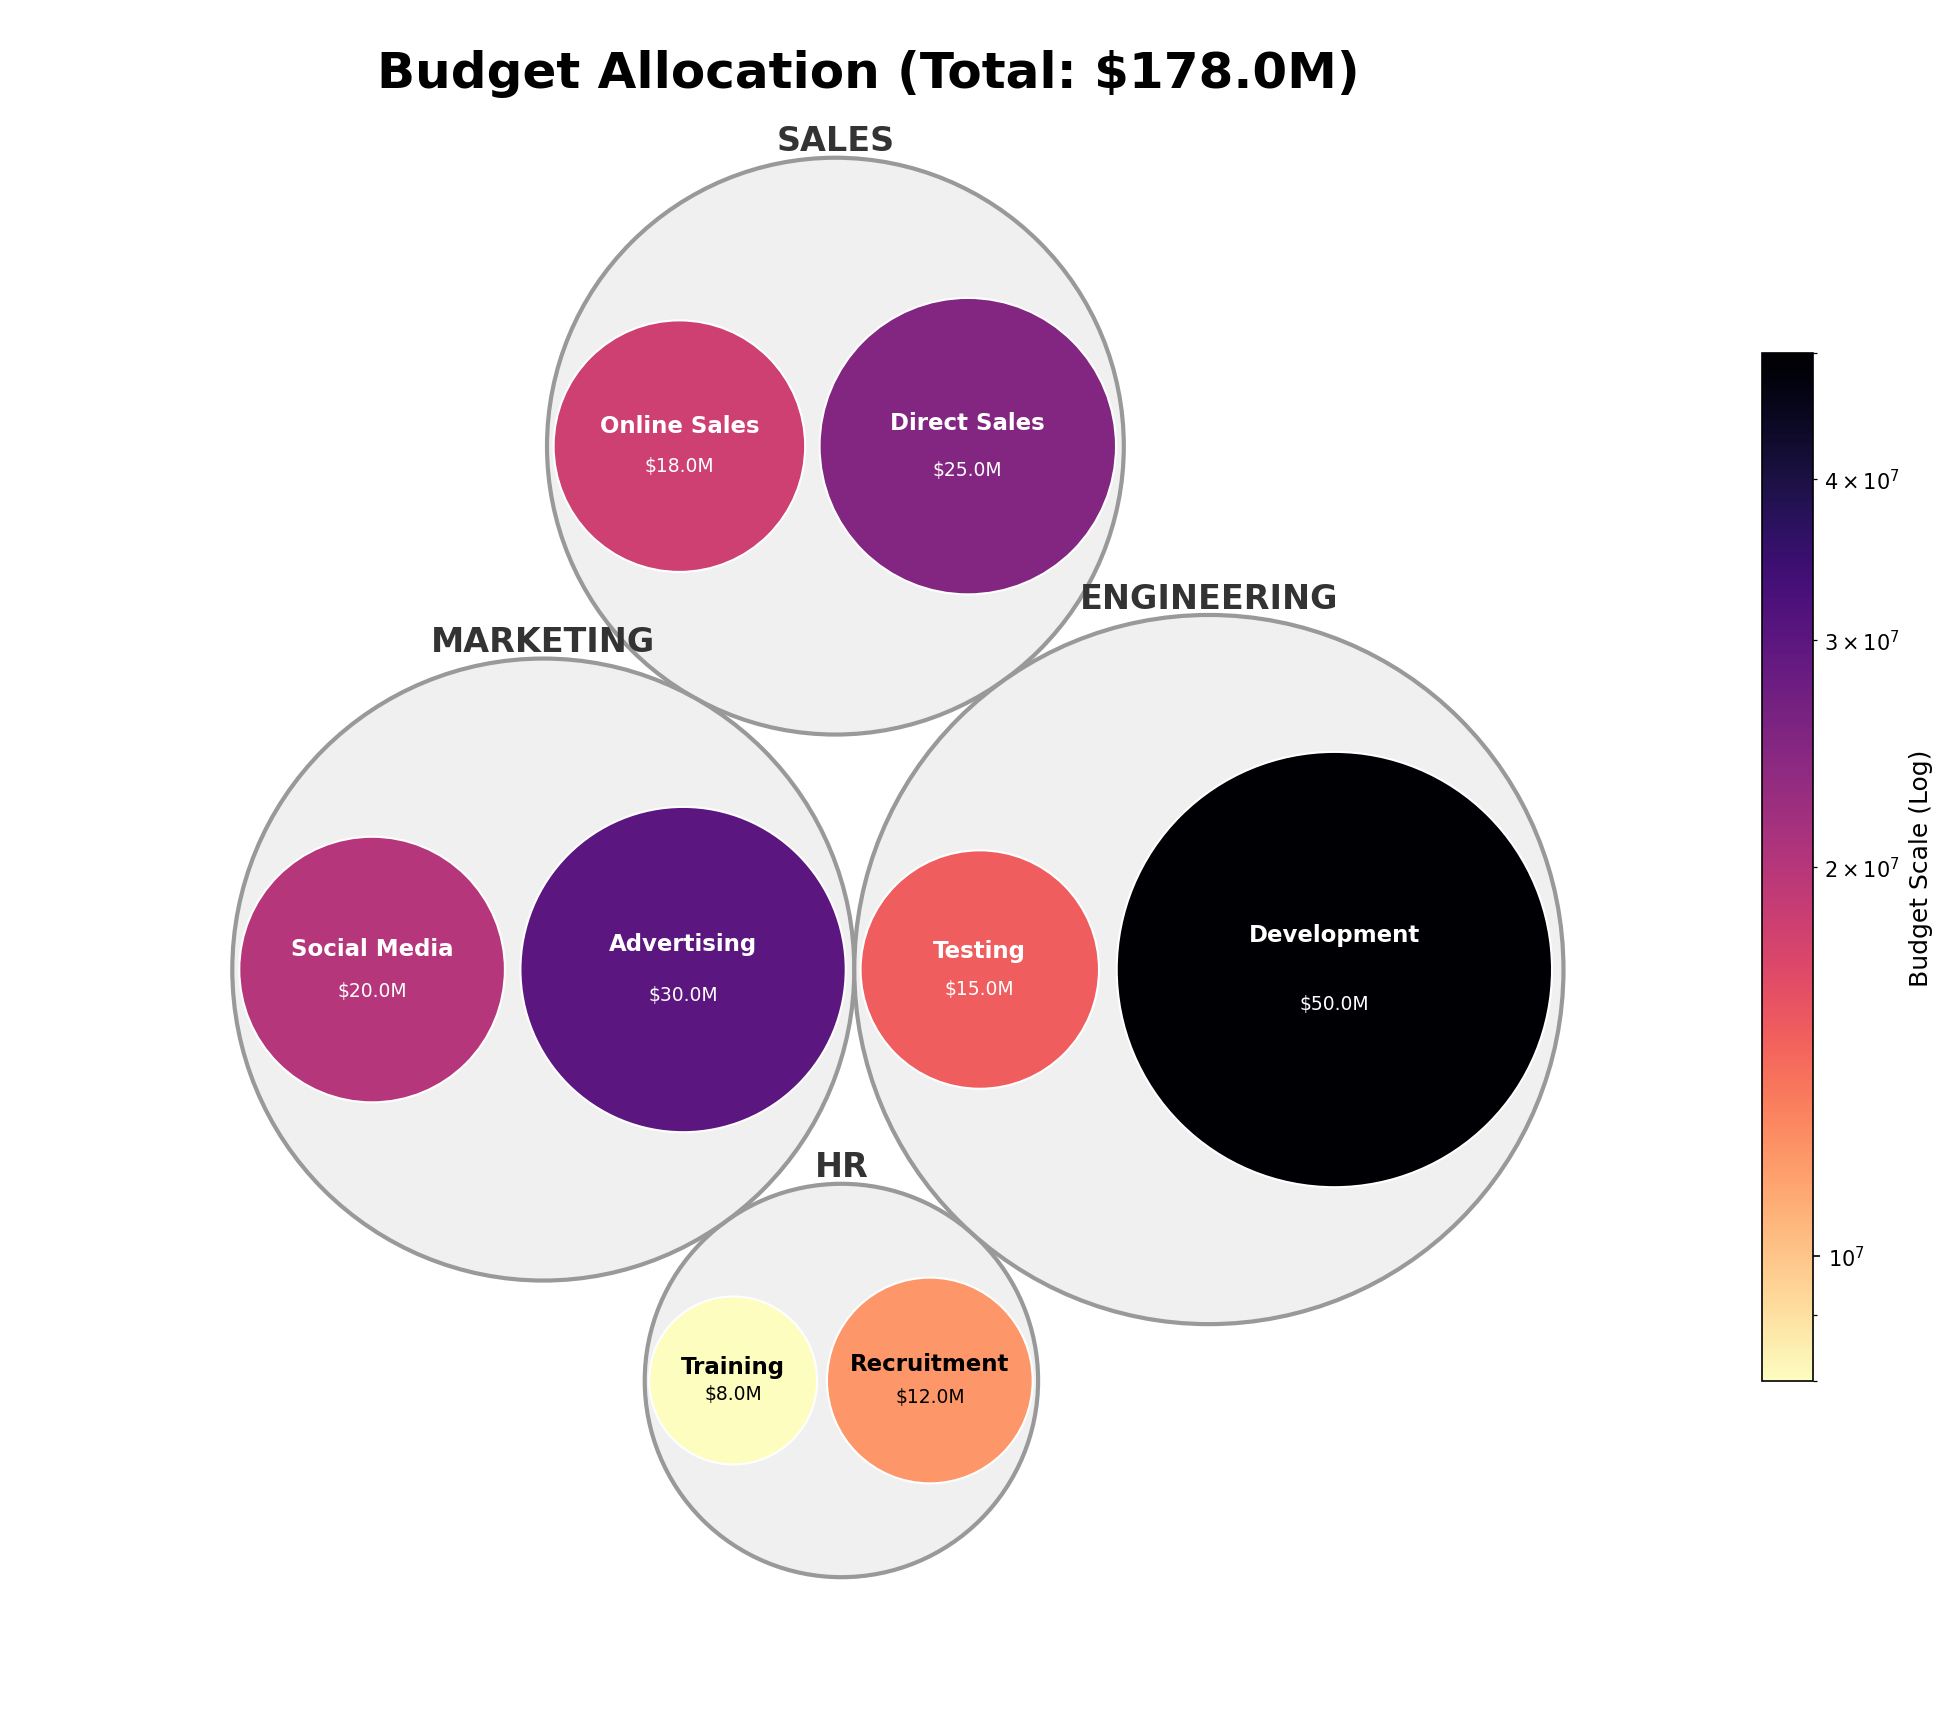
Hierarchical bubble chart showing budget allocation across organizational departments and subcategories. Circle sizes represent proportional budget amounts, while colors indicate absolute budget magnitude on a logarithmic scale. Engineering department receives the largest allocation ($65M), with Development accounting for $50M. Total organizational budget: $178M
Tags
#code#other
0
Creator
85575894-8803-4260-9370-289a4b586346
Published
December 4, 2025
More sharing options
More like this
Similar plots from the gallery.