Menu
Refer a Friend
Share your link — earn +15 permanent plots for every friend who joins.
Sign in to get your referral linkmatplotlibline
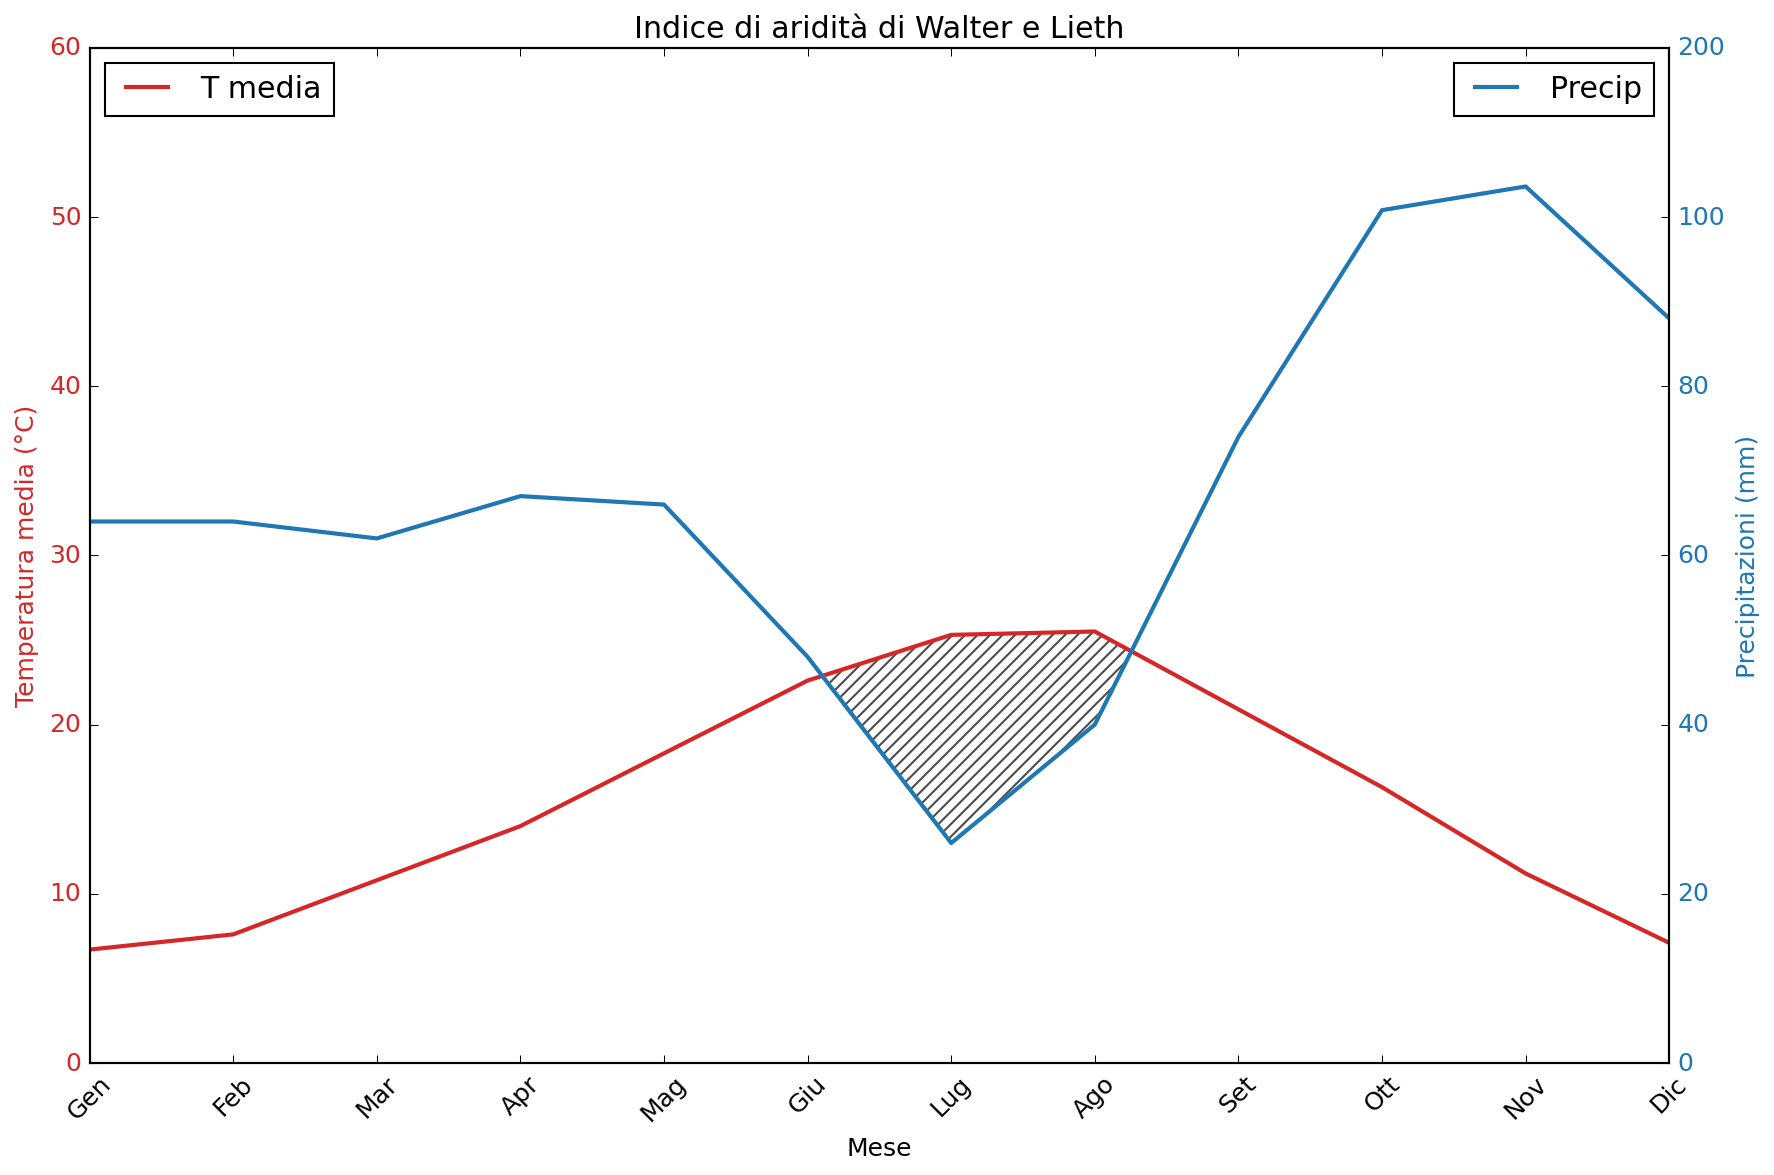
Climogramma di Walter & Lieth
Description
Walter and Lieth aridity index climograph. The graph compares the annual trend of mean temperature (red line, left y-axis in °C) and precipitation (blue line, right y-axis in mm). The hatched area between June and August highlights the arid season, defined by the condition where precipitation is less than twice the temperature ($P < 2T$). This profile, with hot, dry summers and mild, rainy winters, is typical of a Mediterranean climate.
0
Creator
anonymous
Published
October 23, 2025
More sharing options
More like this
Similar plots from the gallery.
matplotlibline
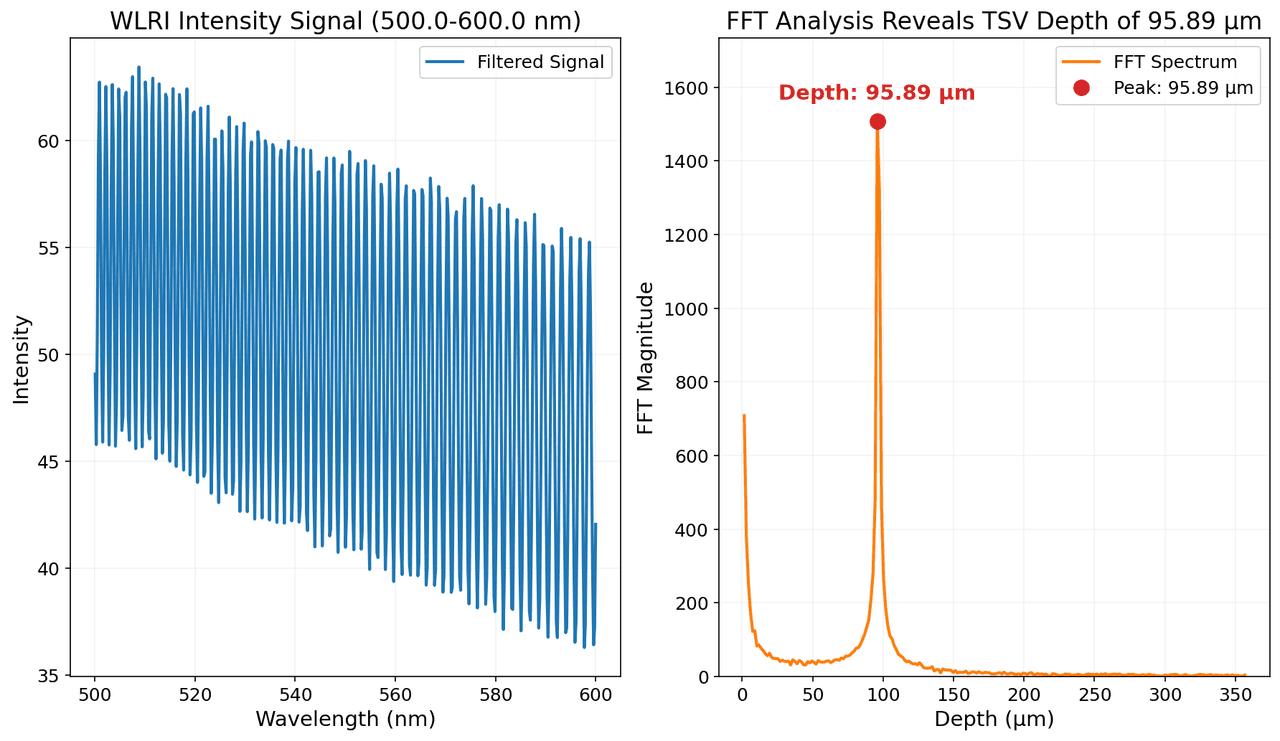
White Light Reflectance Interferometry (WLRI) intensity spectrum and corresponding Fast Fourier Transform (FFT) analysis.
11
matplotlibline
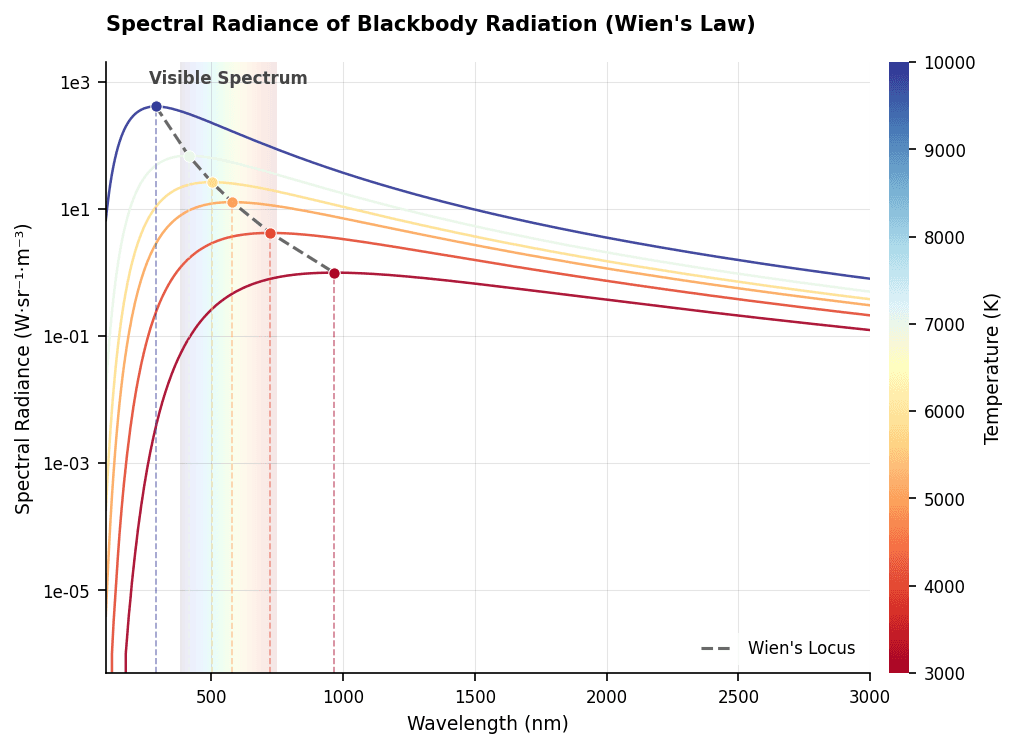
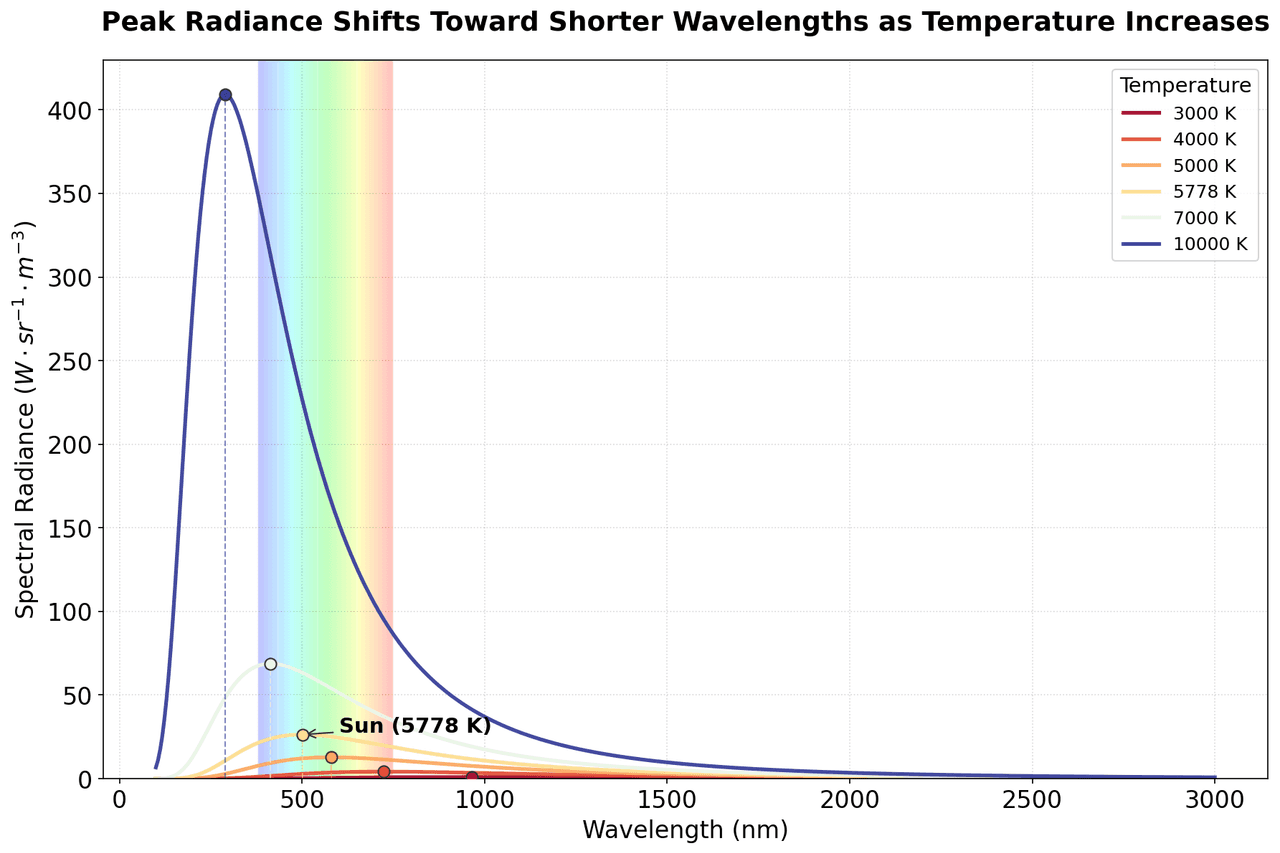
Spectral radiance of blackbody radiation as a function of wavelength for temperatures ranging from cool (red) to hot (blue).
00
matplotlibline
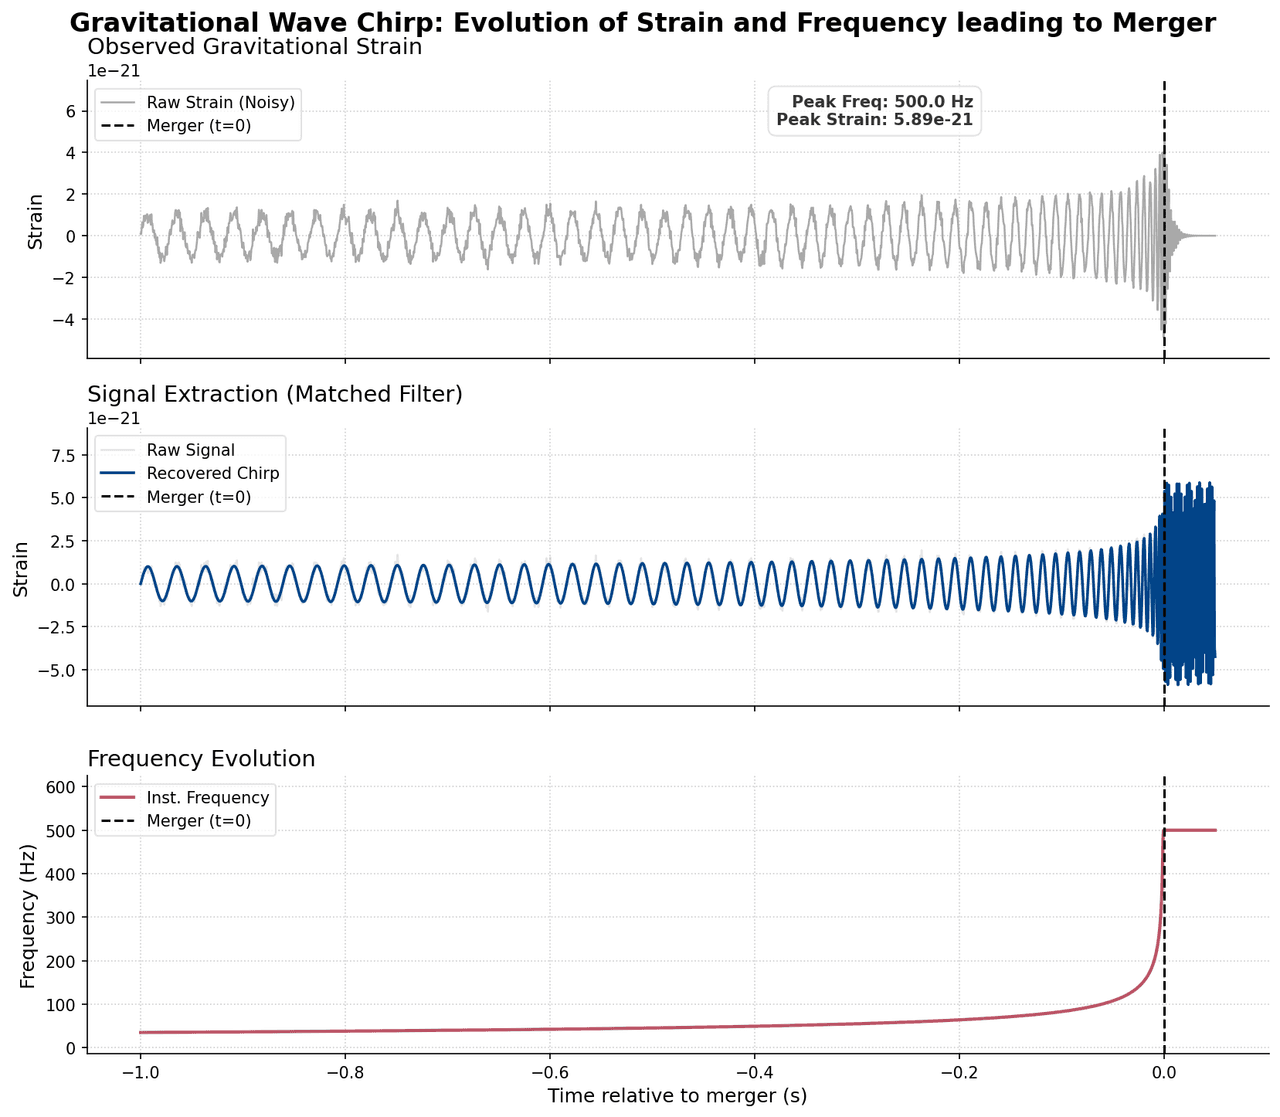
Gravitational waves
00
matplotlibline
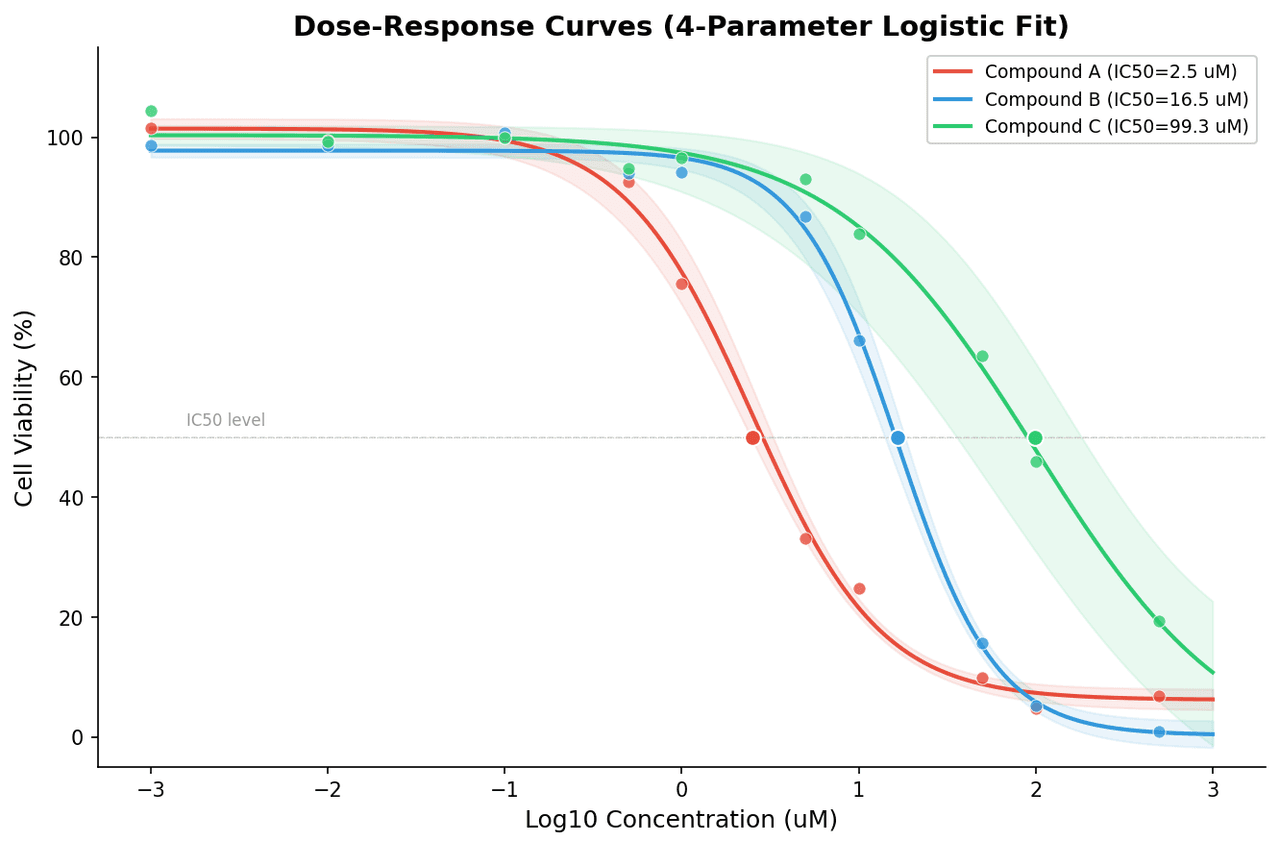
Dose-response curves for three experimental compounds
00
matplotlibline
Spectral radiance is plotted as a function of wavelength for black bodies at various temperatures
11
matplotlibline
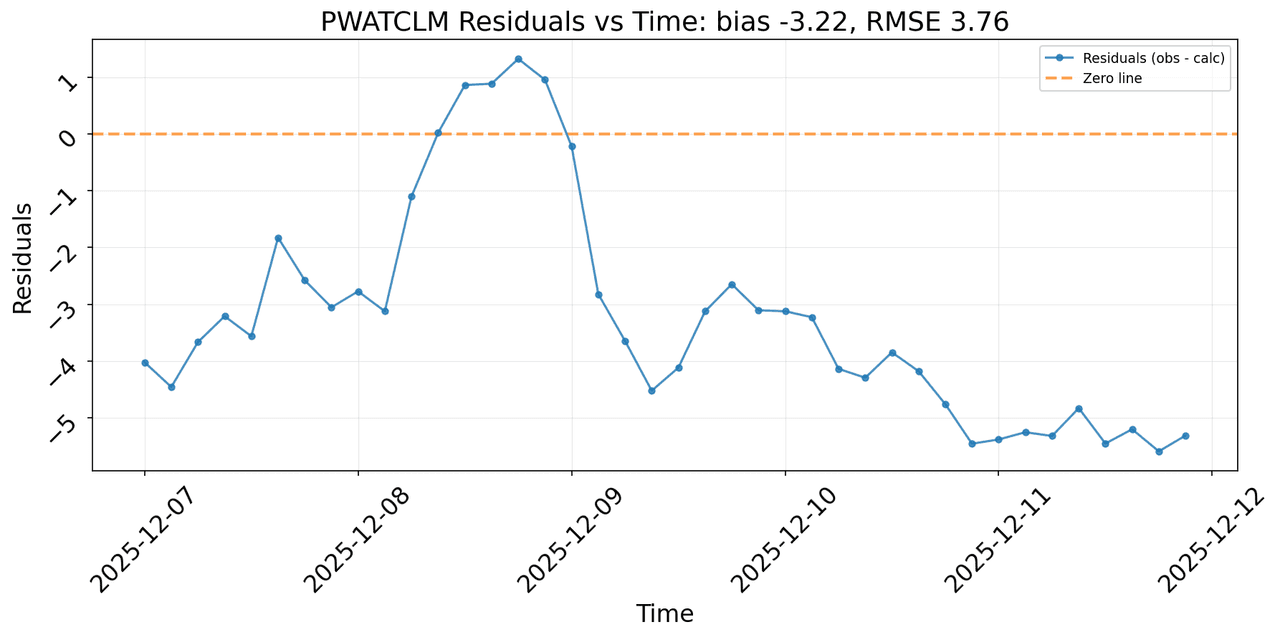
Time series of Precipitable Water residuals (observed minus calculated from 2-m dew point temperature) for 2025-12-07 to 2025-12-08.
00