Menu
Refer a Friend
Share your link — earn +15 permanent plots for every friend who joins.
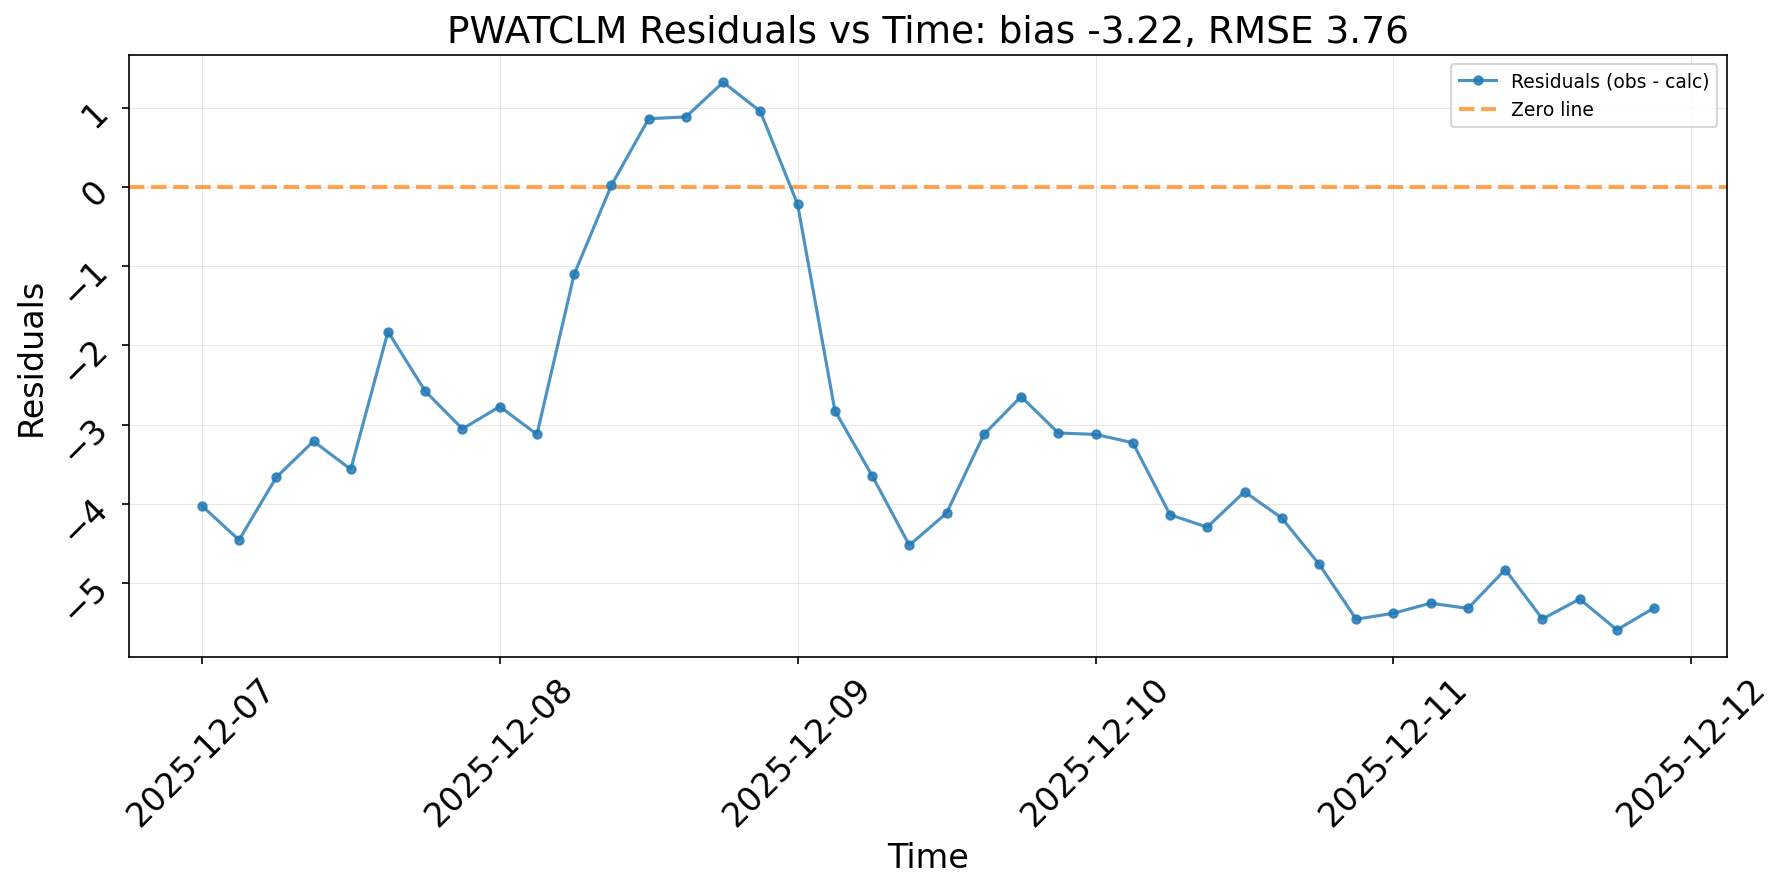
Sign in to get your referral linkTime series of Precipitable Water residuals (observed minus calculated from 2-m dew point temperature) for 2025-12-07 to 2025-12-08.
Description
The visualization presents a time series plot of residuals computed as observed PWATCLM (precipitable water in the atmospheric column) minus PWATCLM values calculated from 2-m dew point temperature (dpt2m) using the empirical exponential formula PWATCLM_calc = 10 × exp(0.1102 + 0.0614 × dpt2m). Over the period from 2025-12-07 00:00 to 2025-12-08 03:00 (10 data points at 3-hour intervals), residuals are consistently negative, ranging from -4.46 to -1.82, indicating systematic overestimation of PWATCLM by the formula. The residuals show temporal fluctuations, with the least negative value (-1.82) at 15:00 on December 7, potentially reflecting diurnal atmospheric variations, and more negative values during early morning hours. Linear regression between PWATCLM_calc (independent) and PWATCLM_obs (dependent) demonstrates strong linear agreement (R² = 0.87), but with a slope >1 and negative intercept, confirming both scale mismatch and offset. This suggests the formula captures much of the variability in PWATCLM driven by dew point temperature but requires bias correction for accurate application in models or forecasts.
Tags
Creator
57343531-6c88-468e-a41a-a14a875e3f74
Published
December 8, 2025
More sharing options
More like this
Similar plots from the gallery.
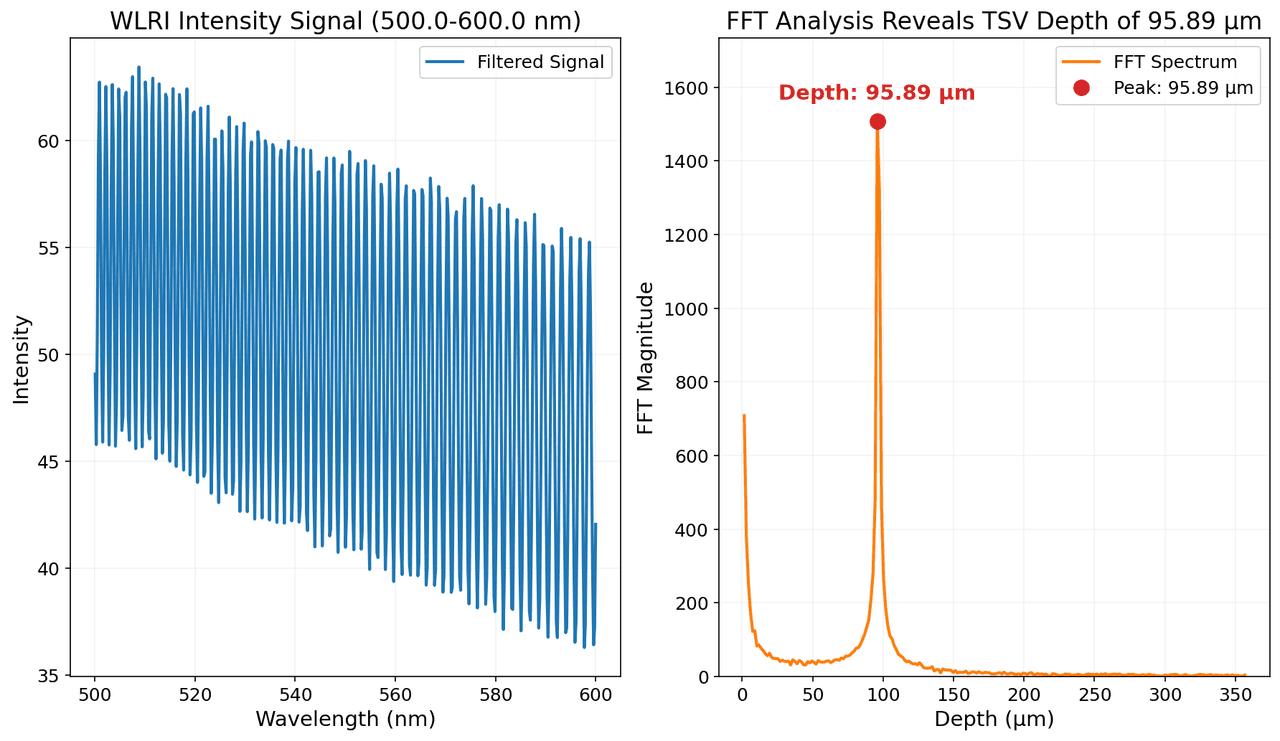
White Light Reflectance Interferometry (WLRI) intensity spectrum and corresponding Fast Fourier Transform (FFT) analysis.
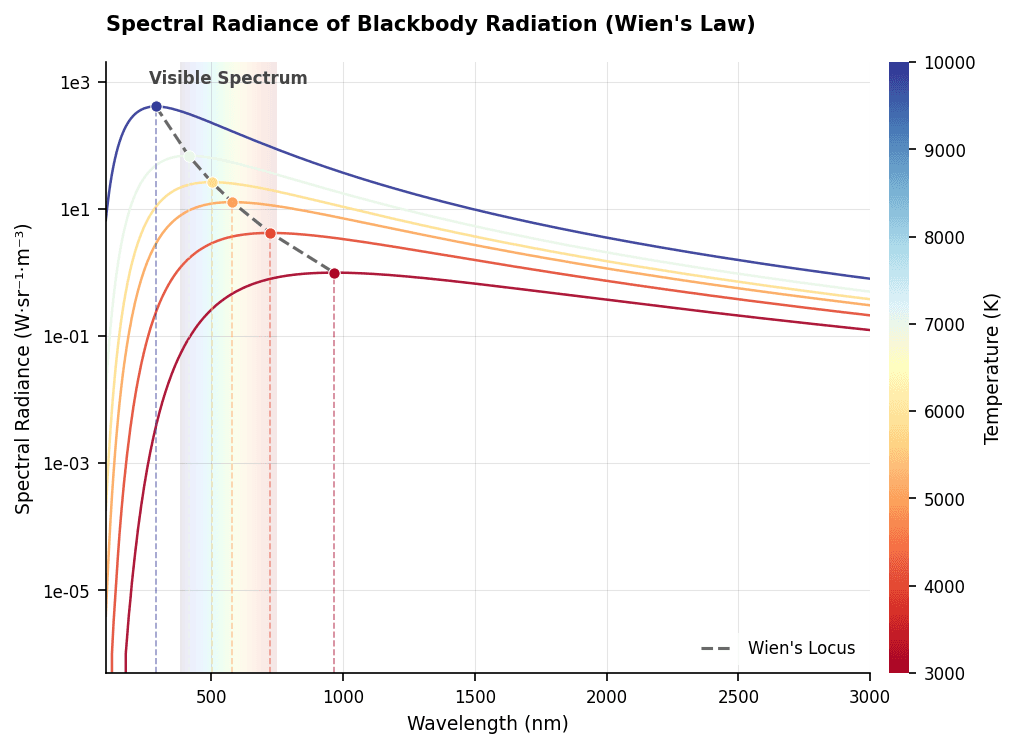
Spectral radiance of blackbody radiation as a function of wavelength for temperatures ranging from cool (red) to hot (blue).
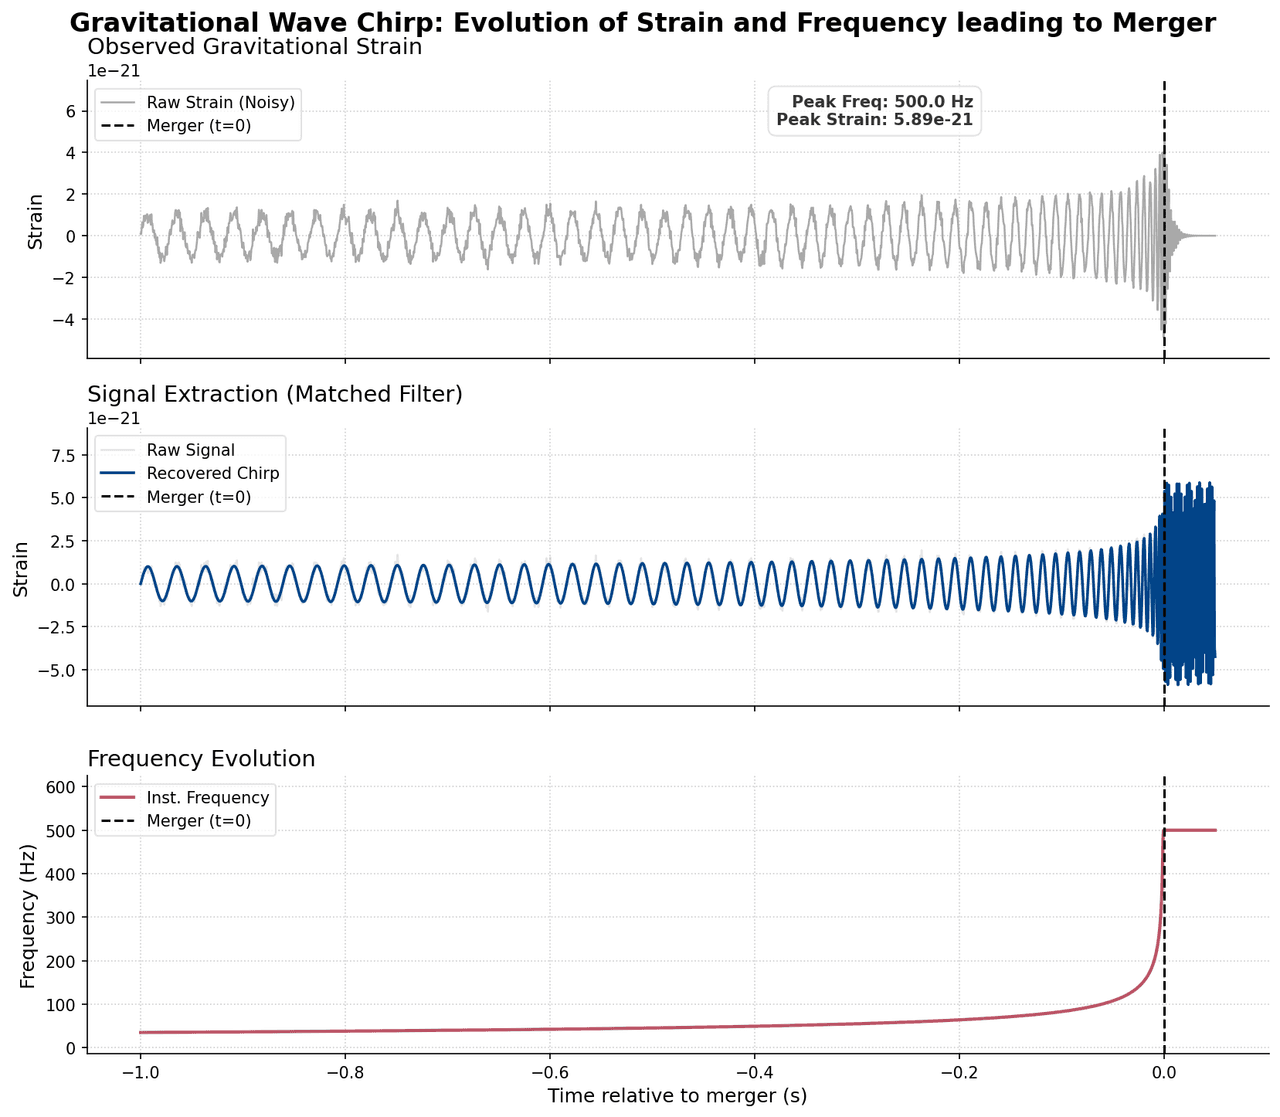
Gravitational waves
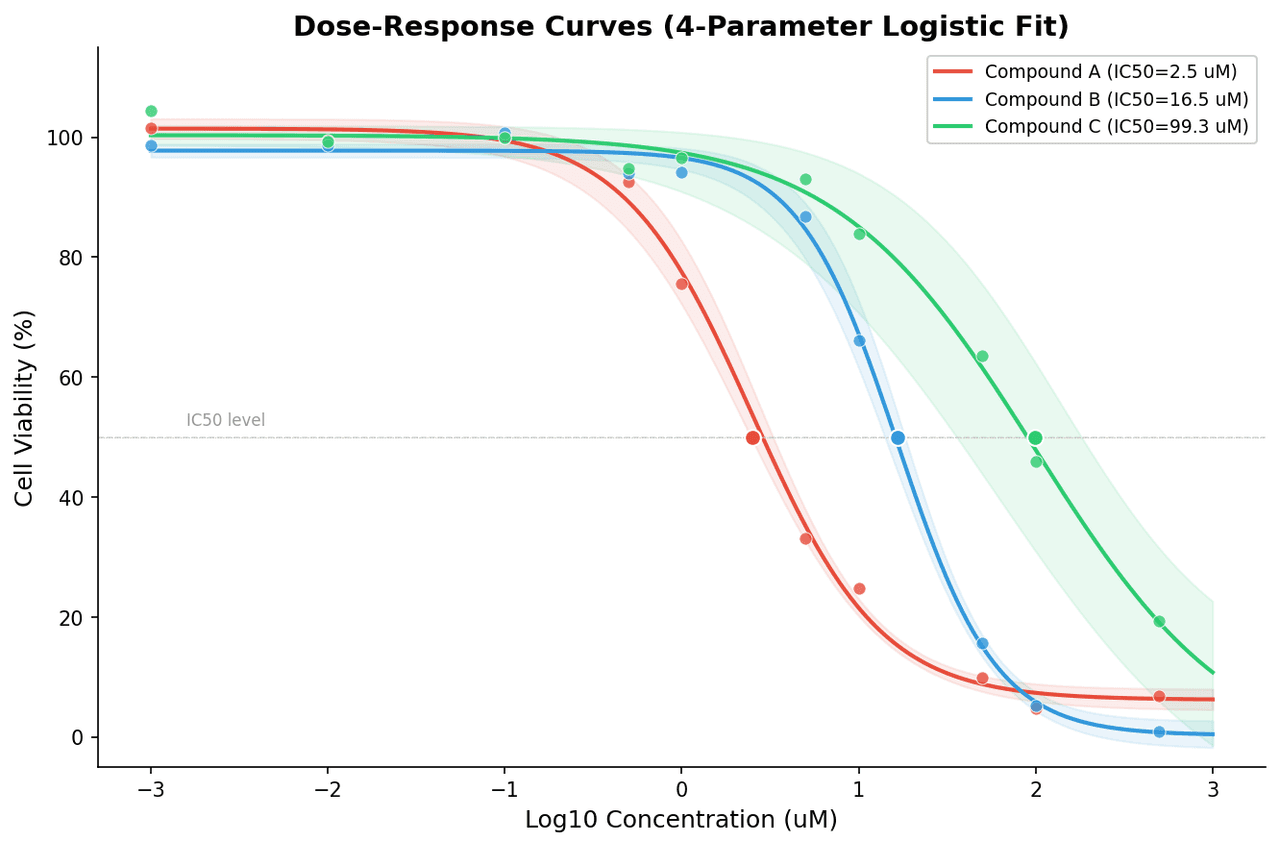
Dose-response curves for three experimental compounds
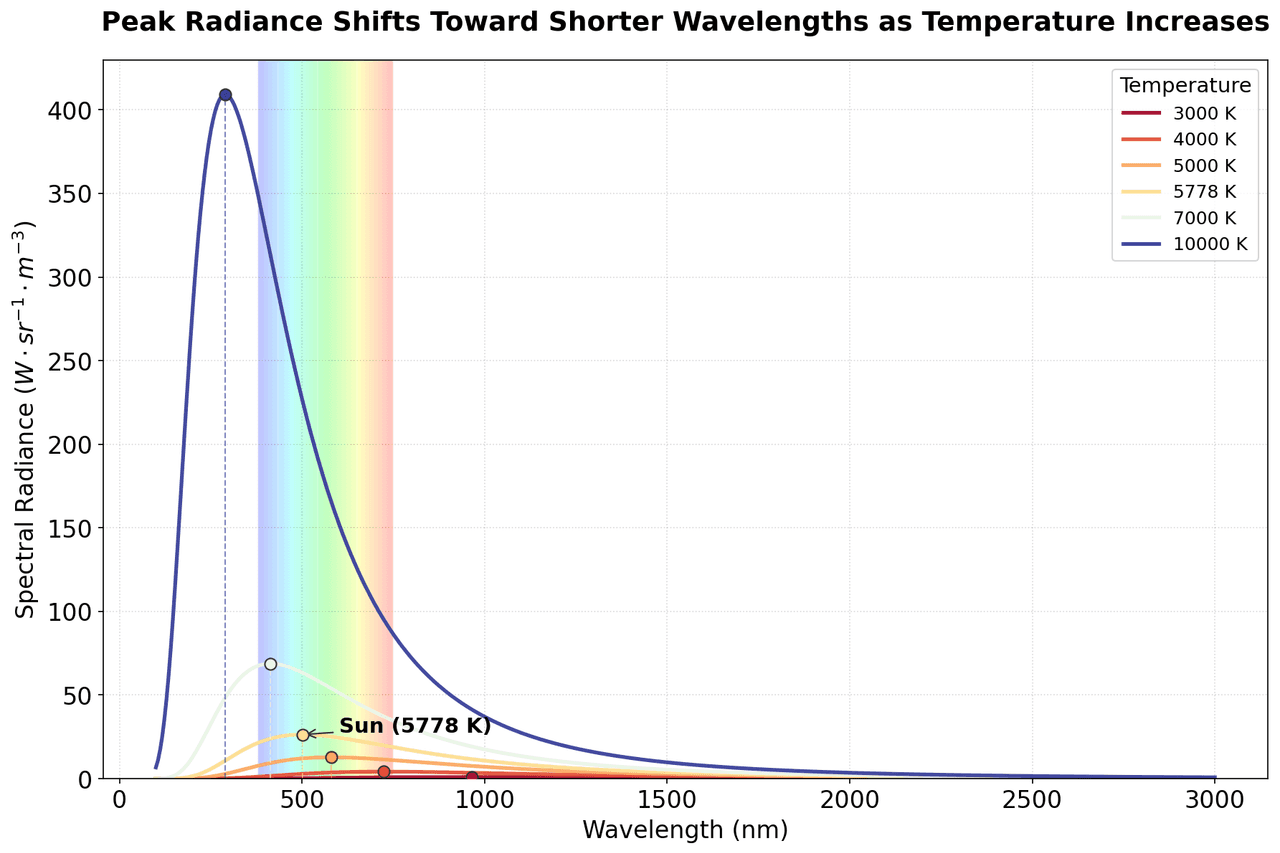
Spectral radiance is plotted as a function of wavelength for black bodies at various temperatures