Menu
Refer a Friend
Share your link — earn +15 permanent plots for every friend who joins.
Sign in to get your referral linkmatplotlibheatmap
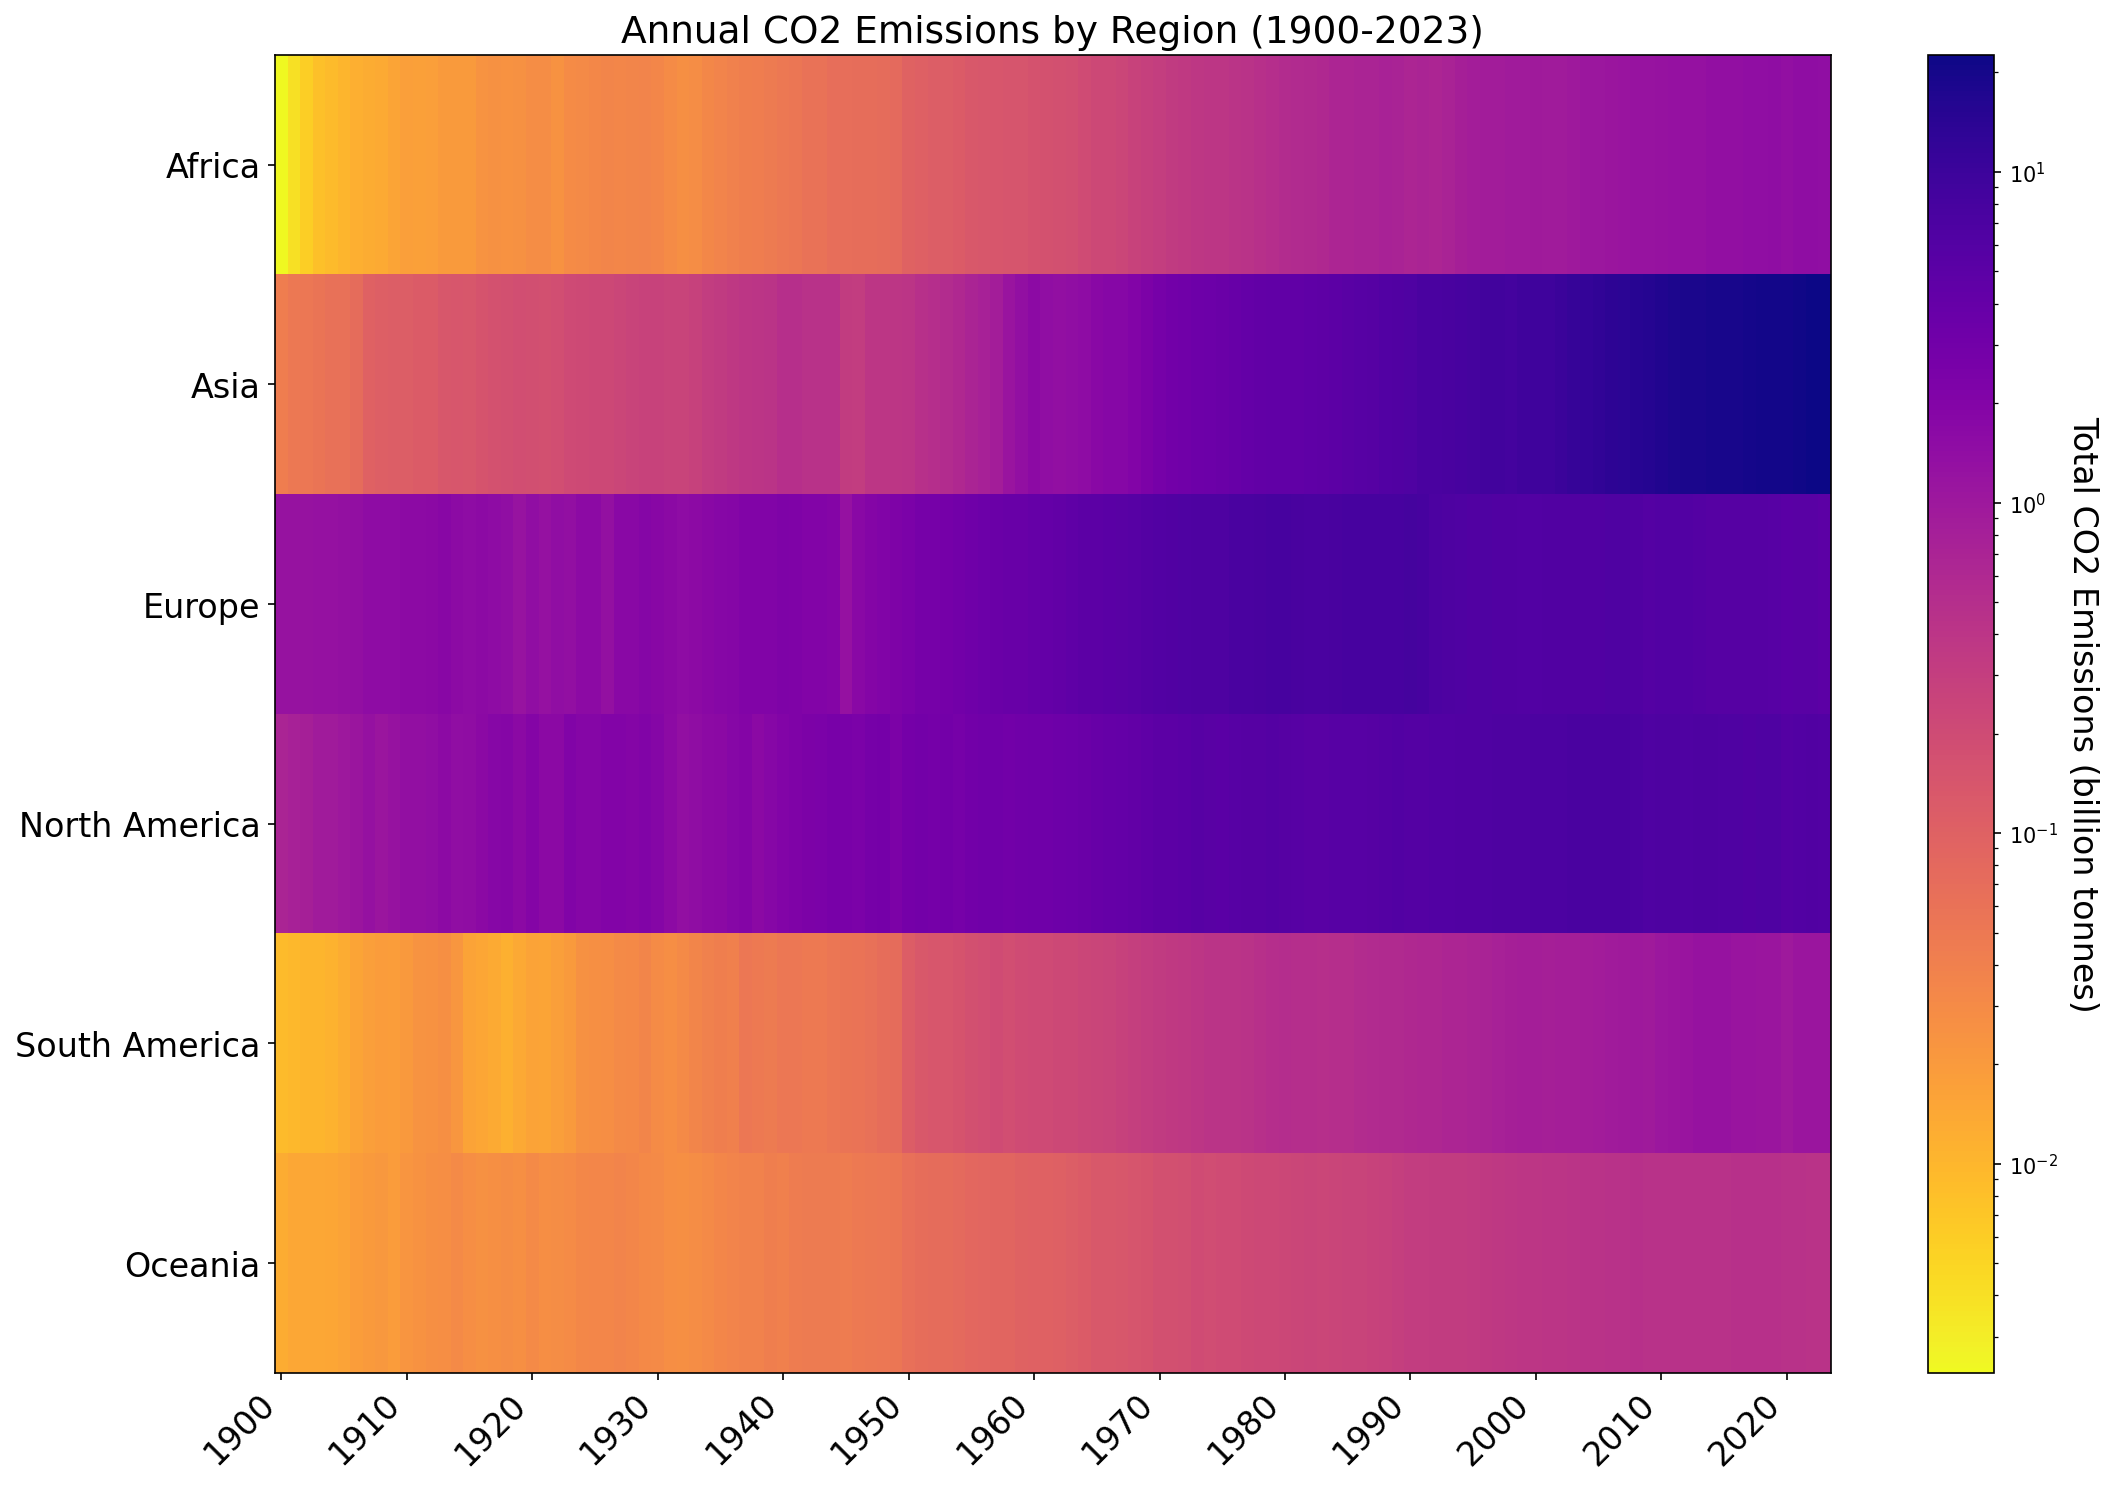
Create a heatmap of annual CO2 emissions by region
Description
Data source: https://ourworldindata.org/grapher/annual-co-emissions-by-region
0
Creator
anonymous
Published
October 18, 2025
More sharing options