Menu
Refer a Friend
Share your link — earn +15 permanent plots for every friend who joins.
Sign in to get your referral linkmatplotlibheatmap
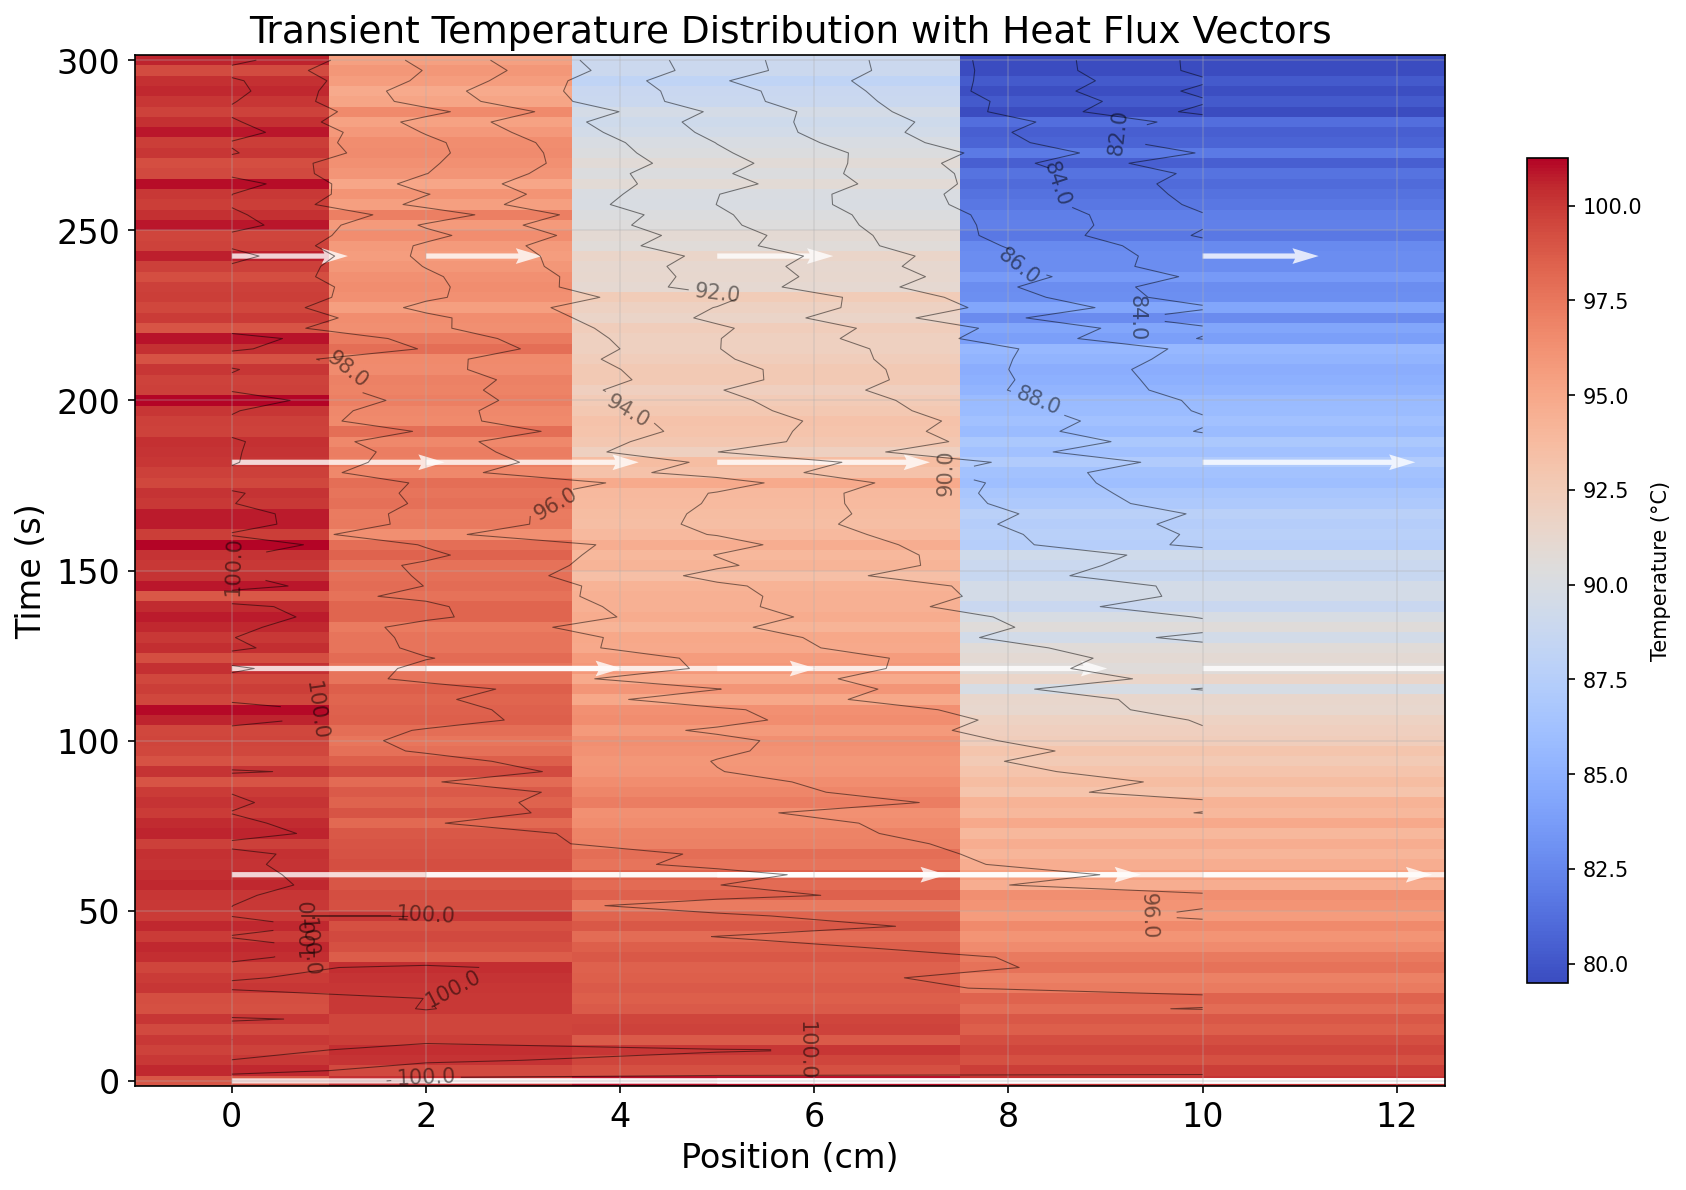
Transient evolution of temperature distribution along the position axis over time
Description
This figure depicts the transient evolution of temperature distribution along the position axis over time, illustrated as a heatmap with a coolwarm colormap ranging from blue (low temperature) to red (high temperature), overlaid with black isotherm contours and white arrows indicating heat flux vectors. It highlights the propagation of the thermal front and the directional heat flow, revealing key patterns in the spatiotemporal dynamics of the heat transfer process.
0
Creator
anonymous
Published
October 31, 2025
More sharing options