Menu
Refer a Friend
Share your link — earn +15 permanent plots for every friend who joins.
Sign in to get your referral linkmatplotlibheatmap
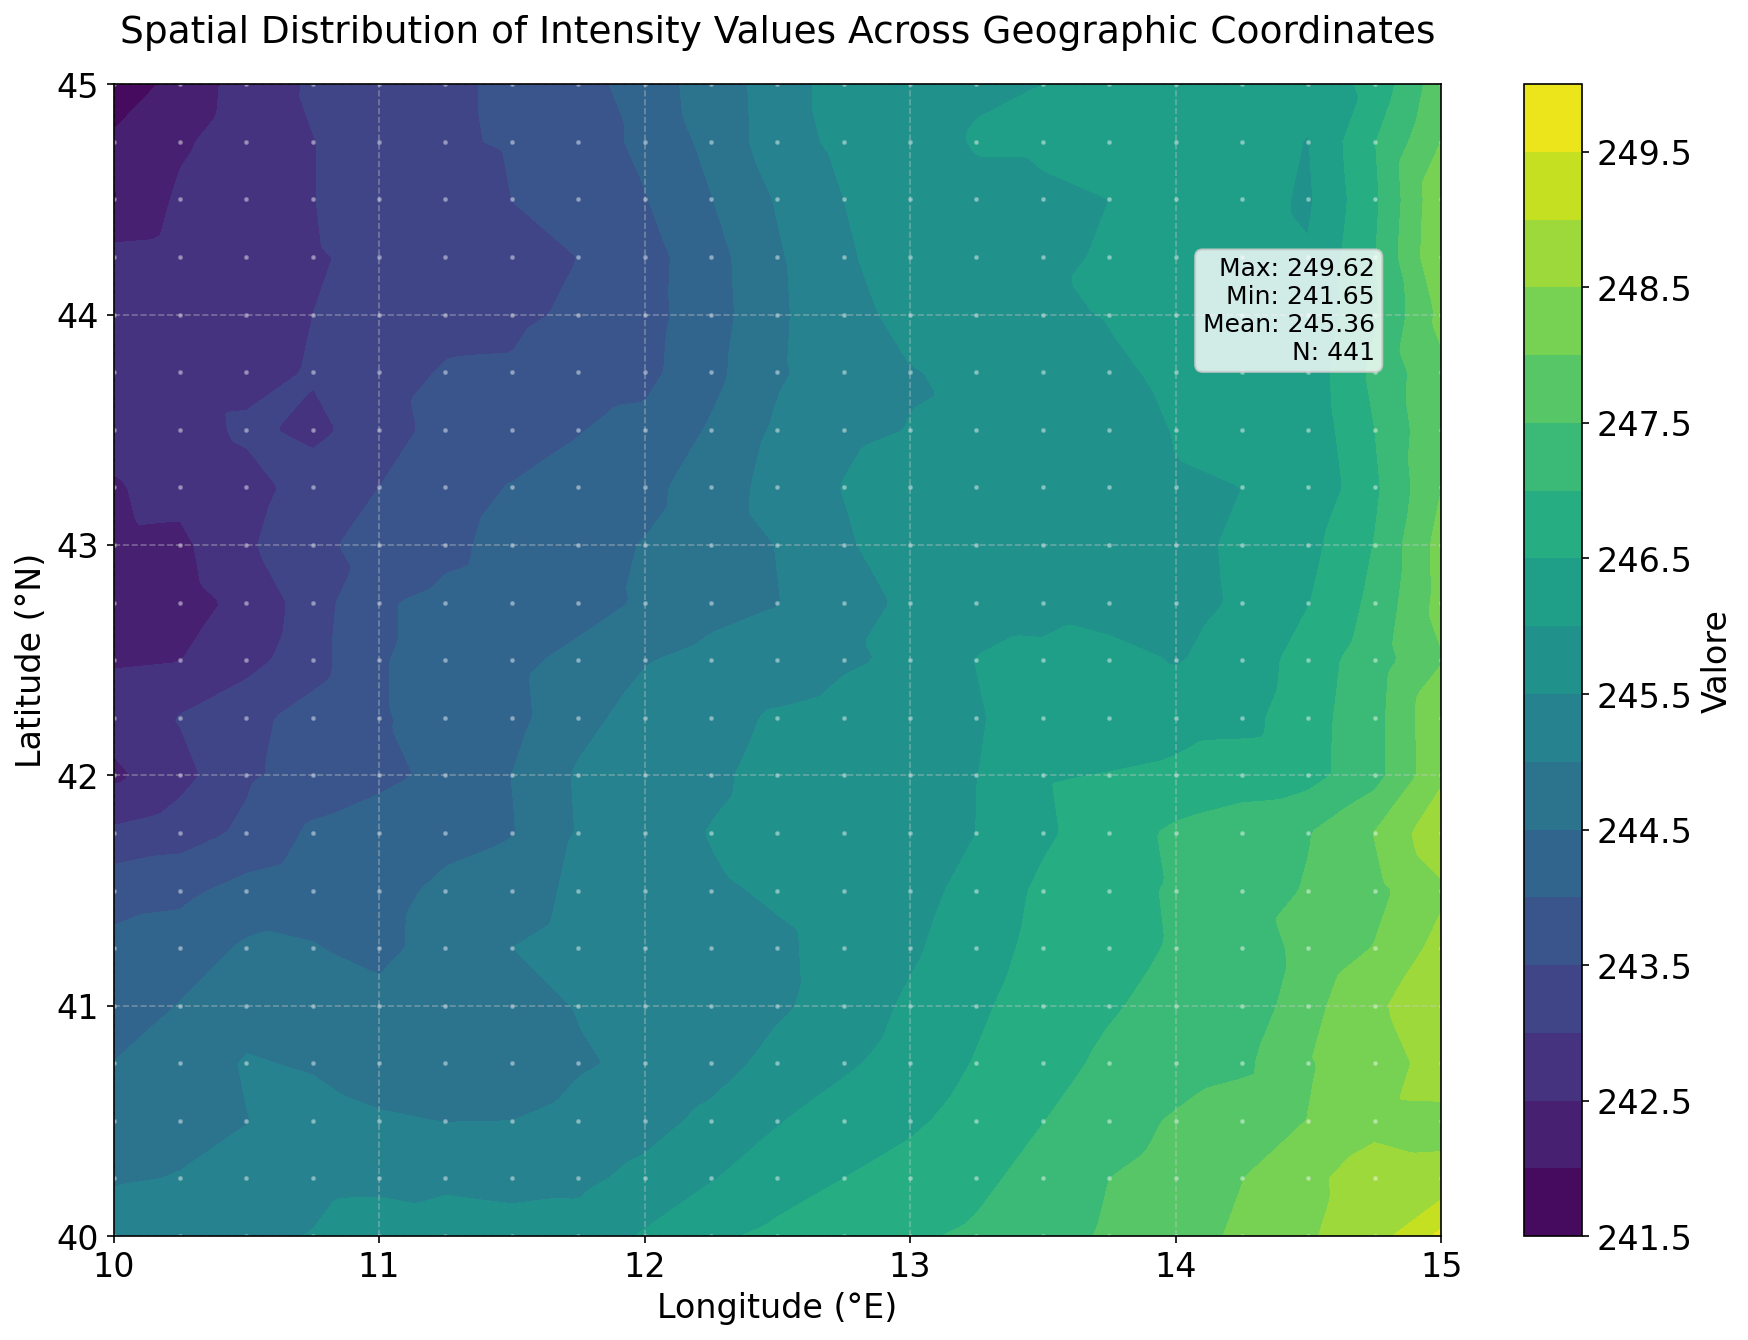
Spatial distribution of intensity values across geographic coordinates
Description
Spatial distribution of intensity values across geographic coordinates, visualized through a linear interpolation heatmap. The color gradient illustrates regional variations in magnitude, highlighting areas of peak intensity and spatial gradients between measurement sites. Statistical summaries, including the mean and range of values, provide a quantitative context for the observed spatial patterns.
Tags
#code#data available#heatmap
4
Creator
85575894-8803-4260-9370-289a4b586346
Published
January 21, 2026
More sharing options