Menu
Refer a Friend
Share your link — earn +15 permanent plots for every friend who joins.
Sign in to get your referral linkInteractive Sounding with cloudy layers
Description
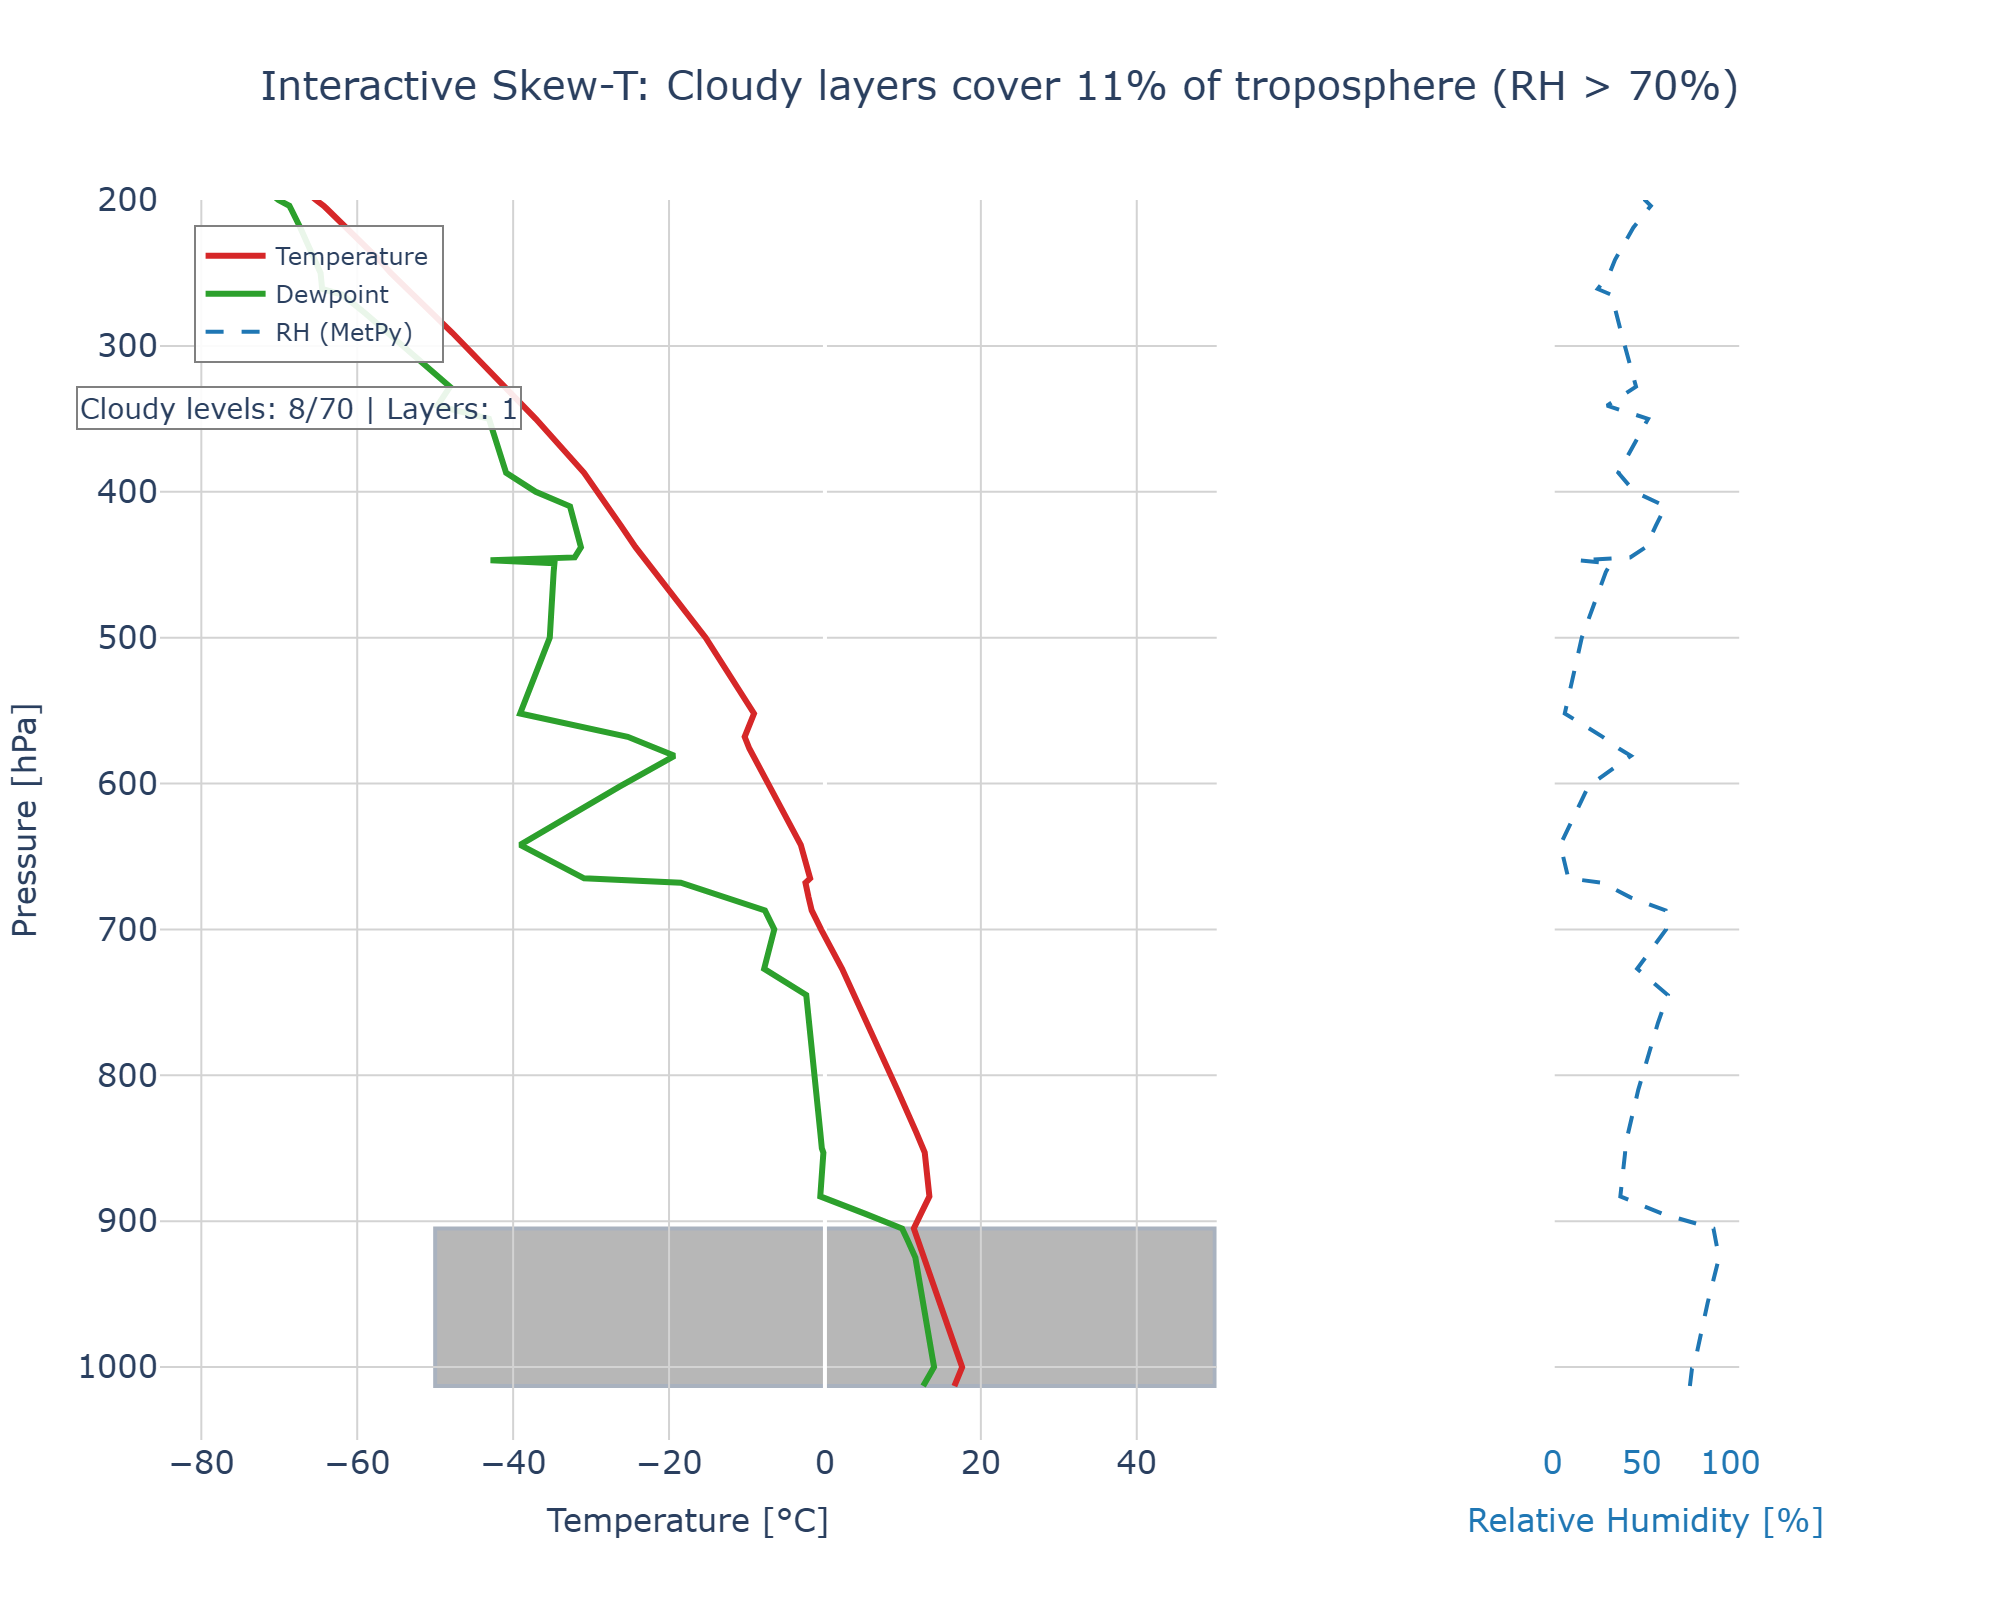
Interactive Skew-T diagram displaying temperature (red) and dewpoint (green) profiles as functions of pressure, with cloudy layers highlighted in dark gray shading where relative humidity exceeds 70%. Relative humidity profile, calculated using verified MetPy functions from temperature and dewpoint data, is shown on the adjacent right panel (dashed blue line). Shaded regions delineate continuous cloudy bands between pressure levels, revealing {len(cloud_layers)} distinct cloud layers comprising {total_cloudy_levels}/{len(p)} levels and covering {cloud_fraction:.0%} of the analyzed tropospheric column. The visualization identifies key saturation zones critical for cloud formation and precipitation potential. Statistical summary indicates significant mid-to-upper level moisture conducive to layered cloud development. Pressure ranges from surface (~1000 hPa) to upper troposphere (~200 hPa) following standard meteorological convention.
Tags
Creator
57343531-6c88-468e-a41a-a14a875e3f74
Published
November 16, 2025
More sharing options
More like this
Similar plots from the gallery.

Dashboard
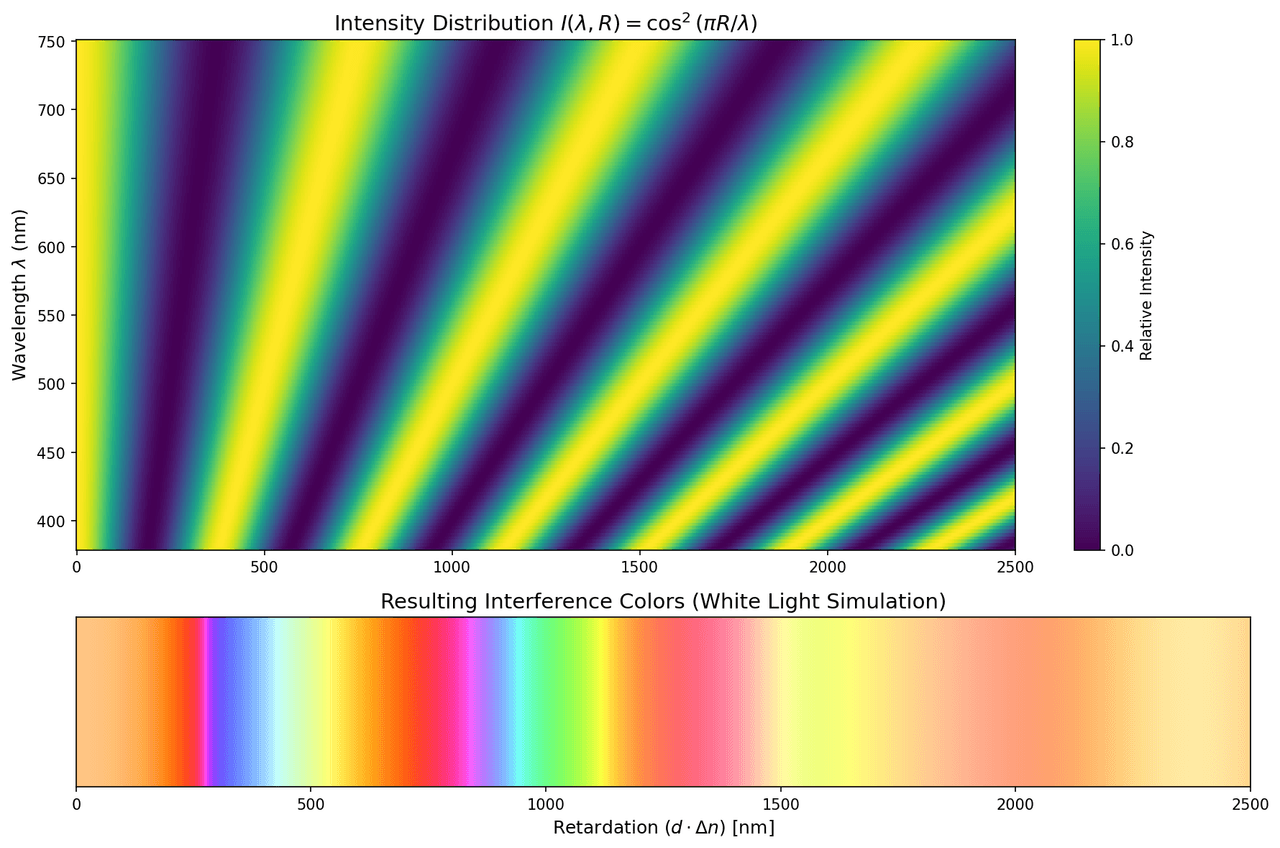
Variation of light intensity as a function of birefringence
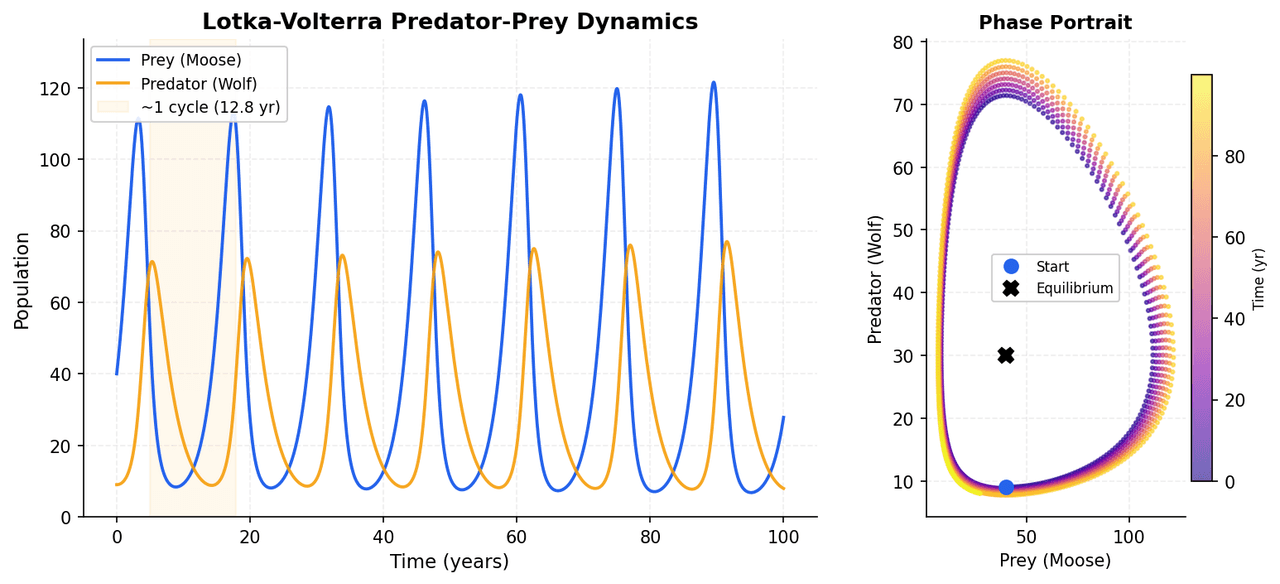
Population dynamics of a predator-prey system
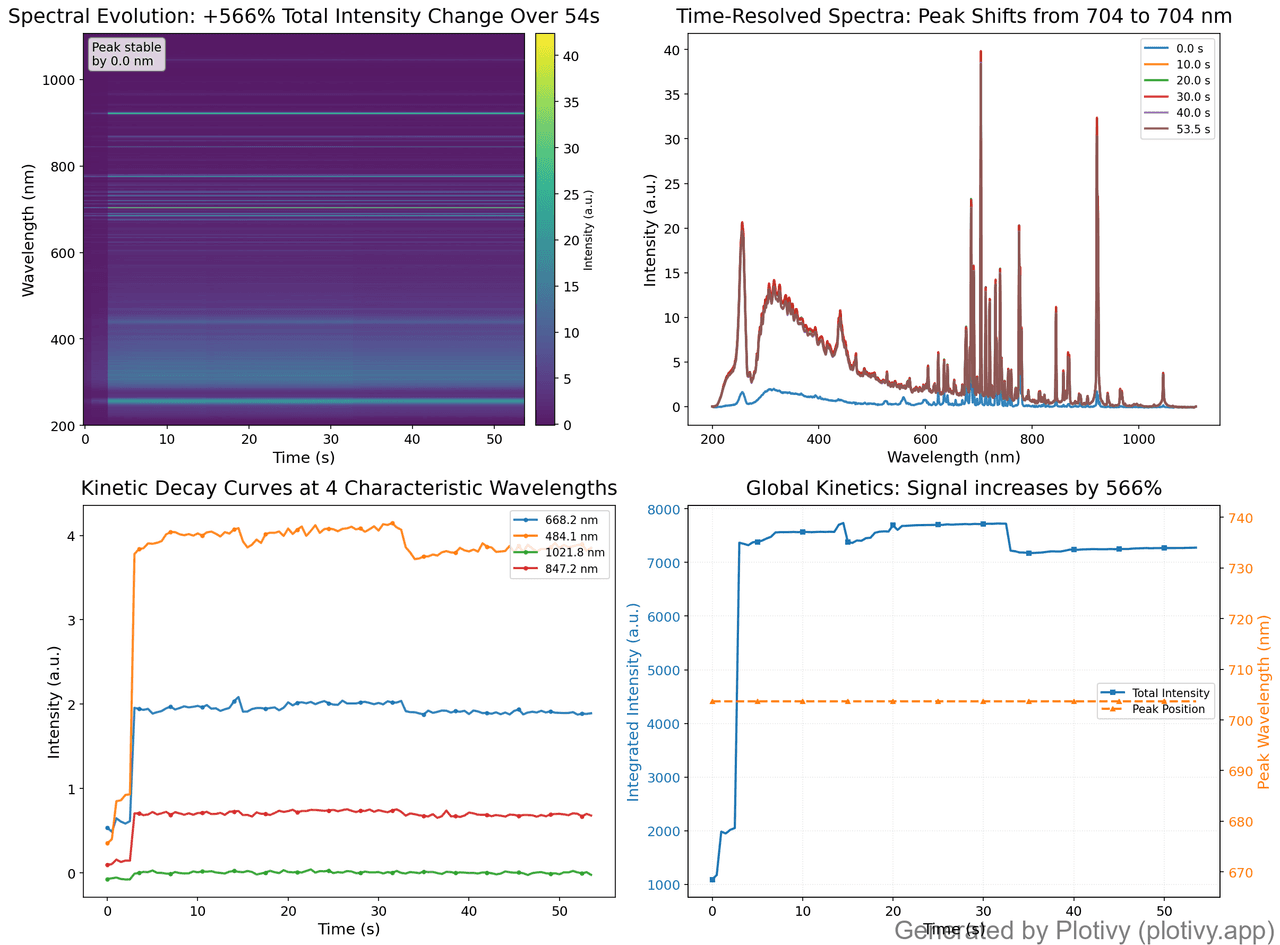
Comprehensive spectroscopic dashboard
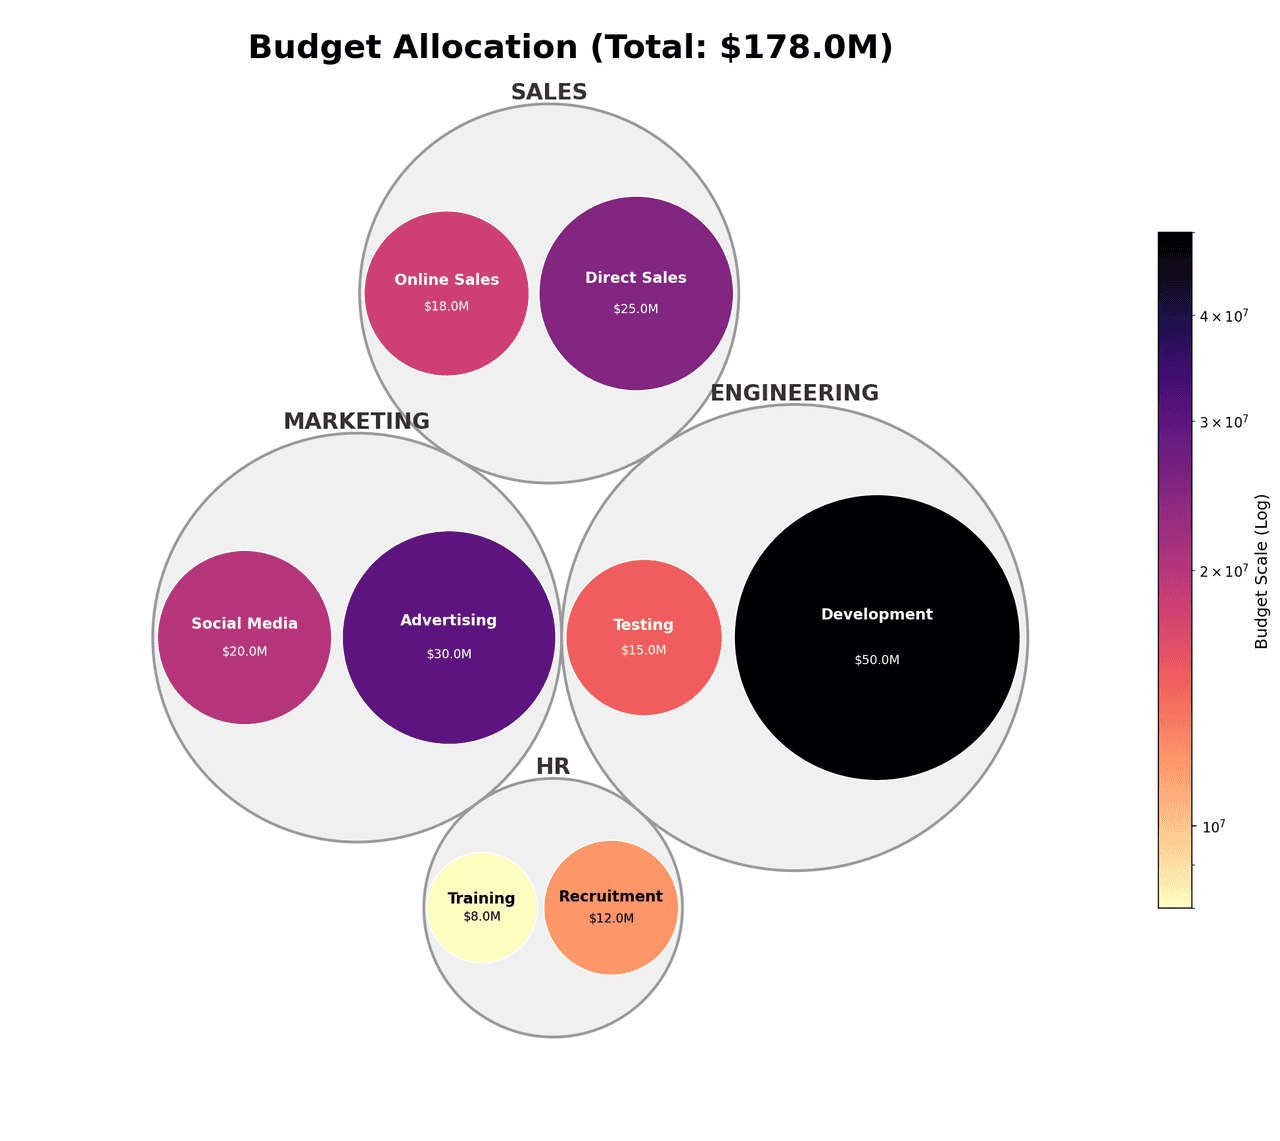
Hierarchical bubble chart