Menu
Refer a Friend
Share your link — earn +15 permanent plots for every friend who joins.
Sign in to get your referral linkPropagation loss in a silicon waveguide
Description
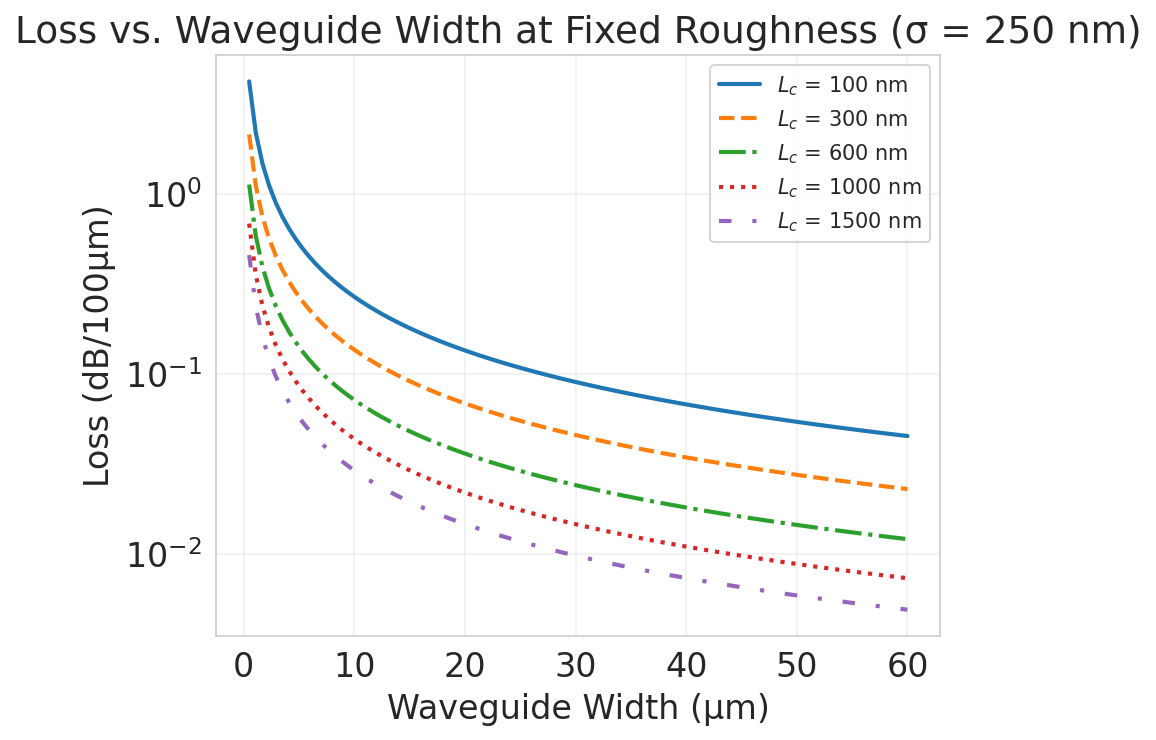
Calculated propagation loss in a silicon waveguide (λ = 1.55 μm, n_core = 3.4765, n_clad = 1) as a function of waveguide width at fixed surface roughness (σ = 250 nm), for varying sidewall correlation lengths (L_c = 100, 300, 600, 1000, 1500 nm). Loss decreases rapidly with increasing width, transitioning from multimode to single-mode regimes, with longer correlation lengths yielding lower losses due to reduced scattering efficiency. The logarithmic scale highlights the strong inverse dependence on width, emphasizing the importance of precise fabrication for low-loss photonics.
Tags
Creator
anonymous
Published
November 8, 2025
More sharing options
More like this
Similar plots from the gallery.
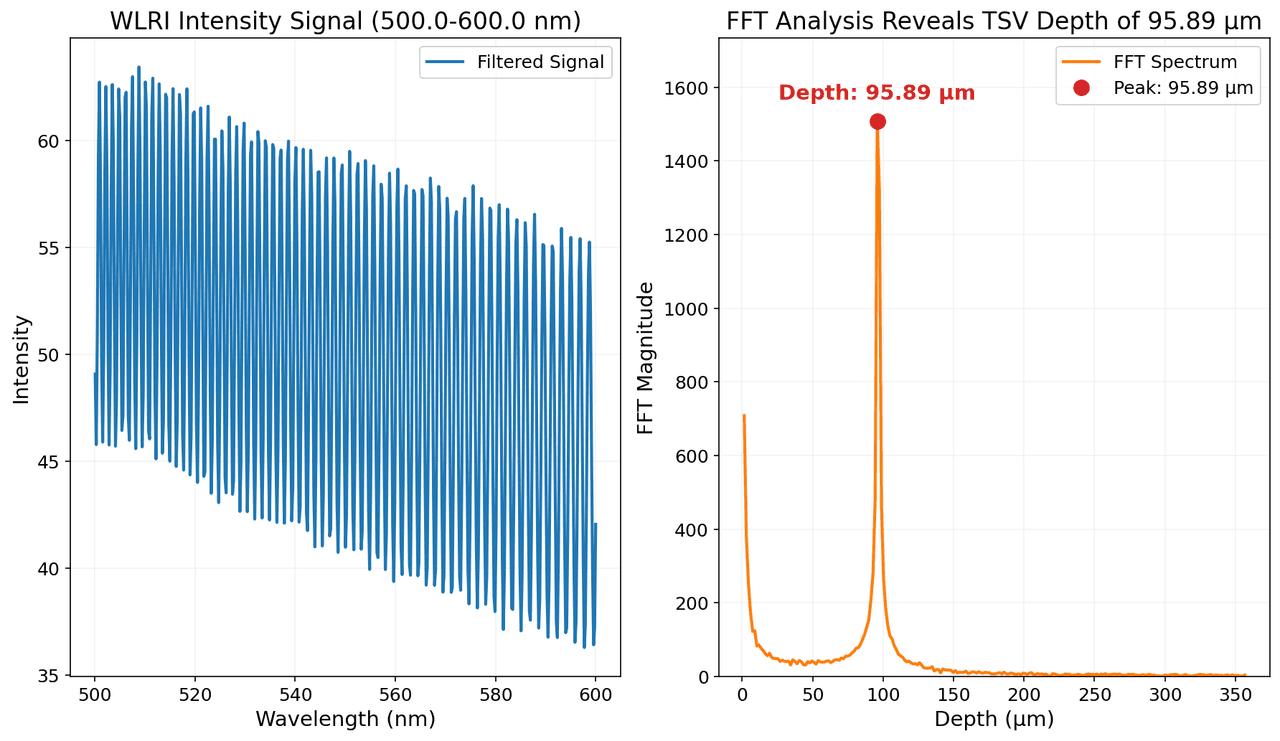
White Light Reflectance Interferometry (WLRI) intensity spectrum and corresponding Fast Fourier Transform (FFT) analysis.
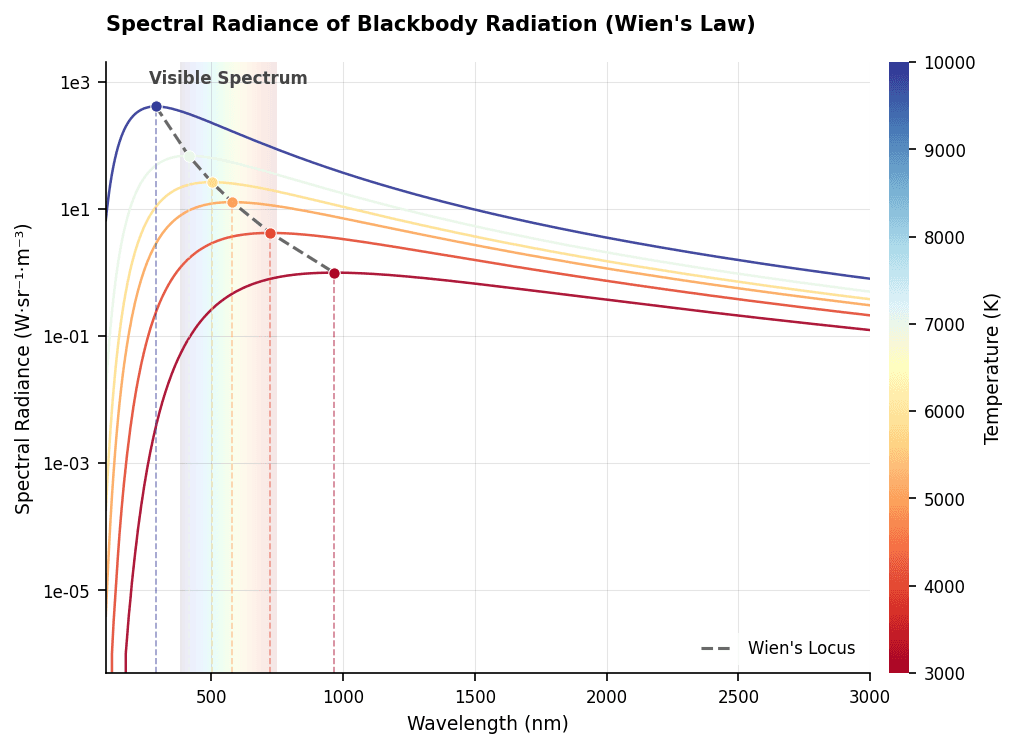
Spectral radiance of blackbody radiation as a function of wavelength for temperatures ranging from cool (red) to hot (blue).
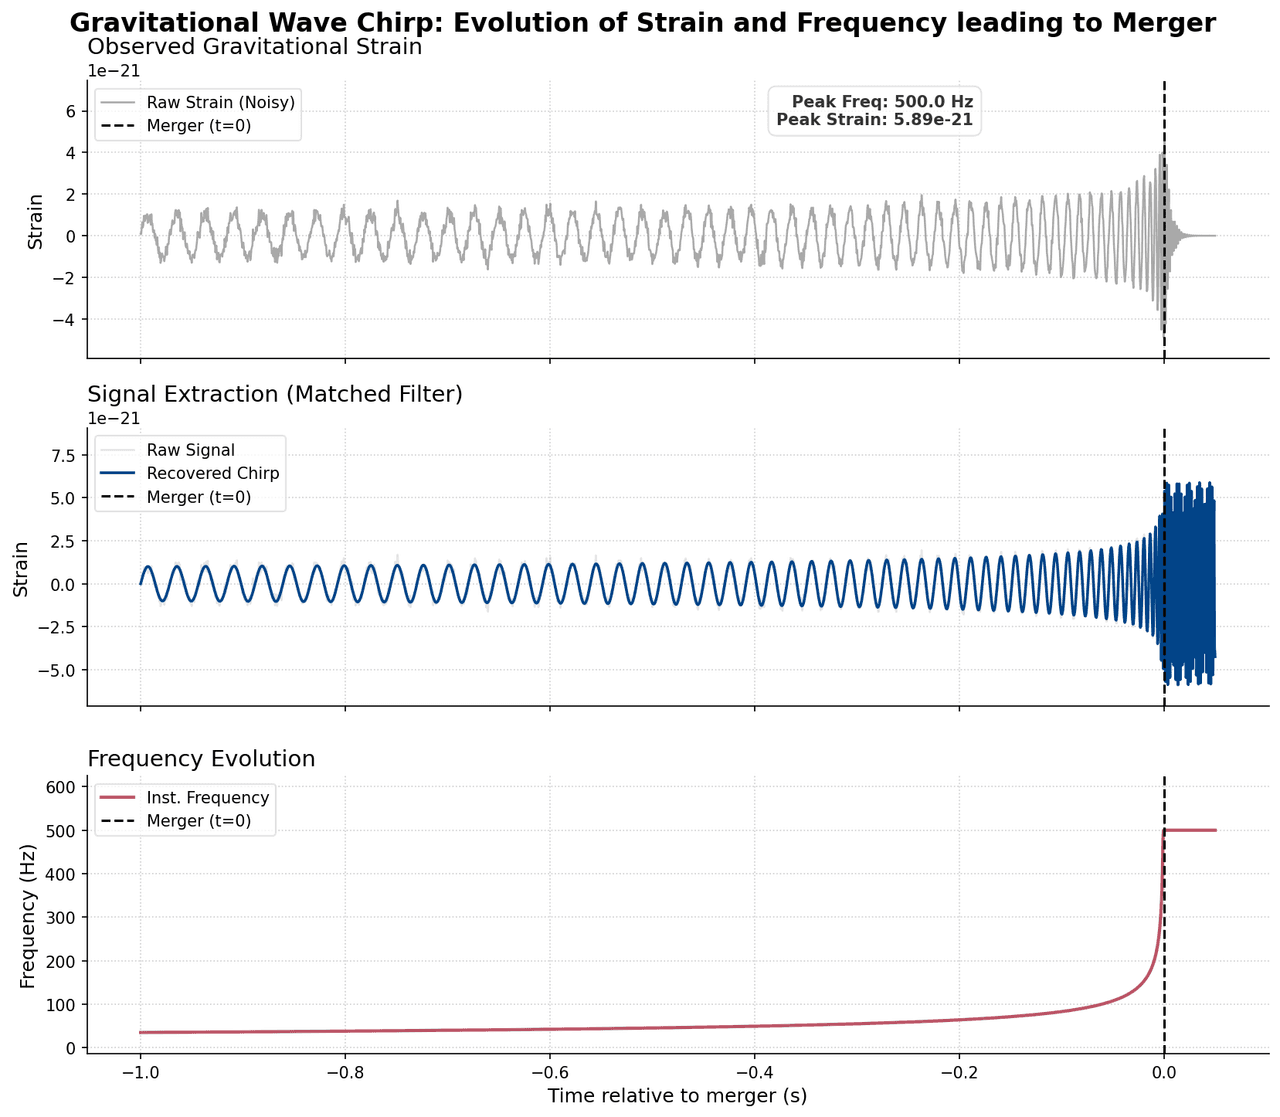
Gravitational waves
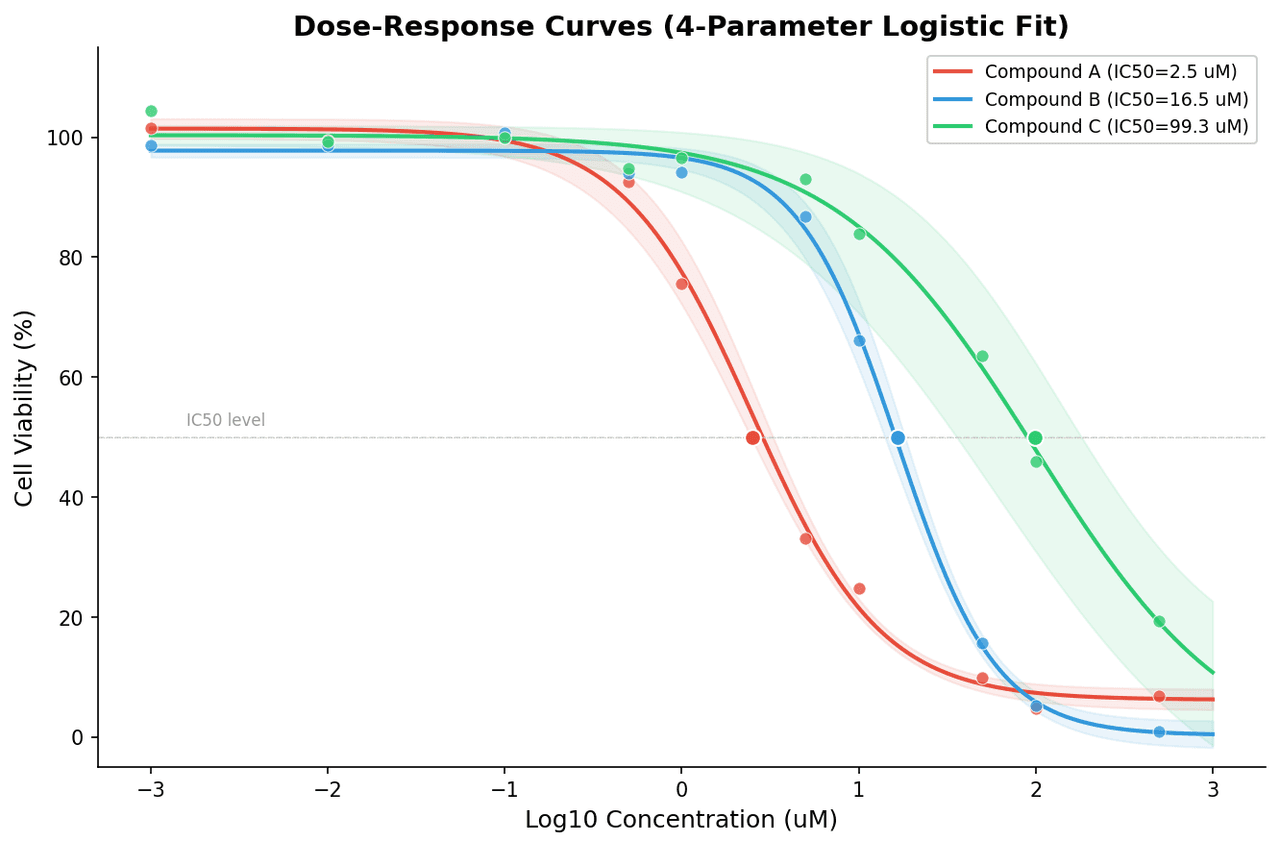
Dose-response curves for three experimental compounds
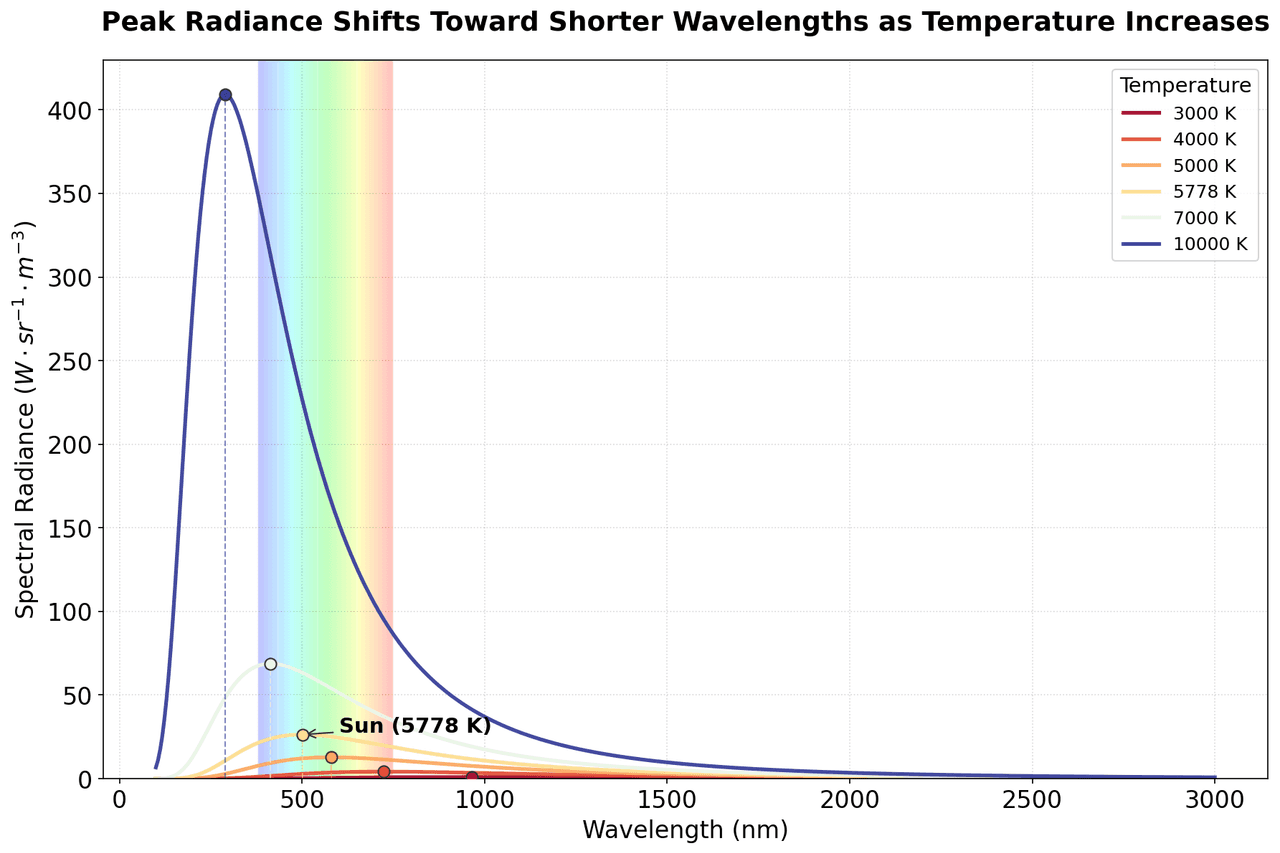
Spectral radiance is plotted as a function of wavelength for black bodies at various temperatures