Menu
Refer a Friend
Share your link — earn +15 permanent plots for every friend who joins.
Sign in to get your referral linkRolling 8-point (~24 h) Pearson correlation coefficient (r) between precipitable water vapor (pwatclm) and 2 m dewpoint temperature (dpt2m).
Description
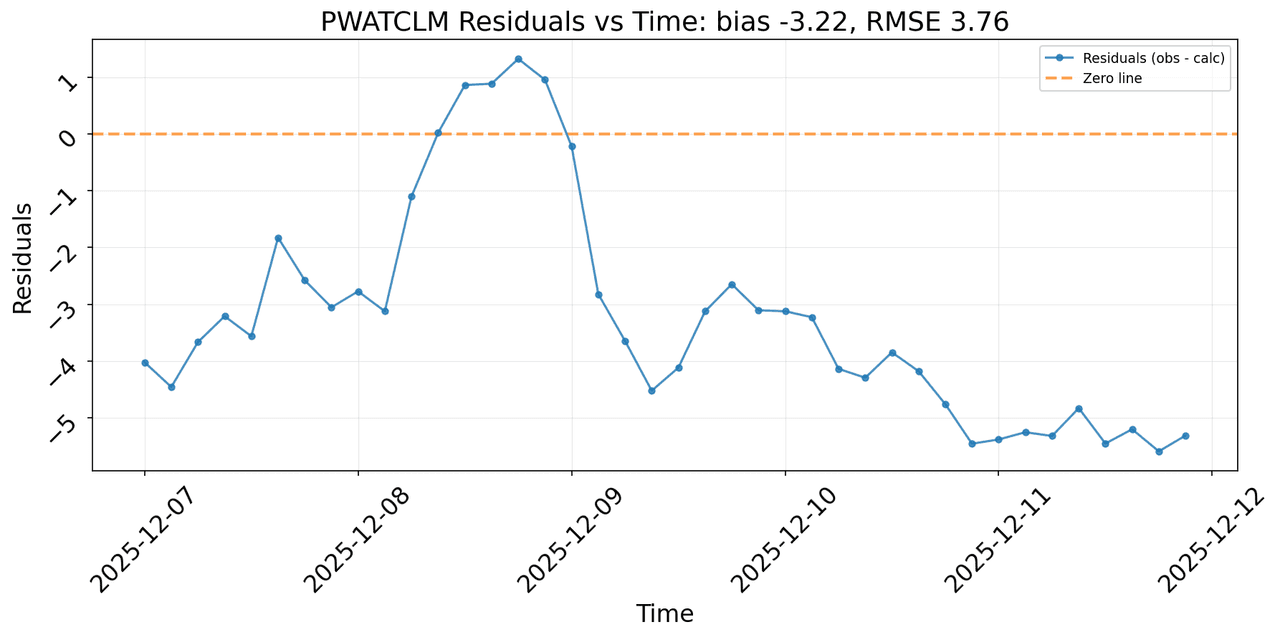
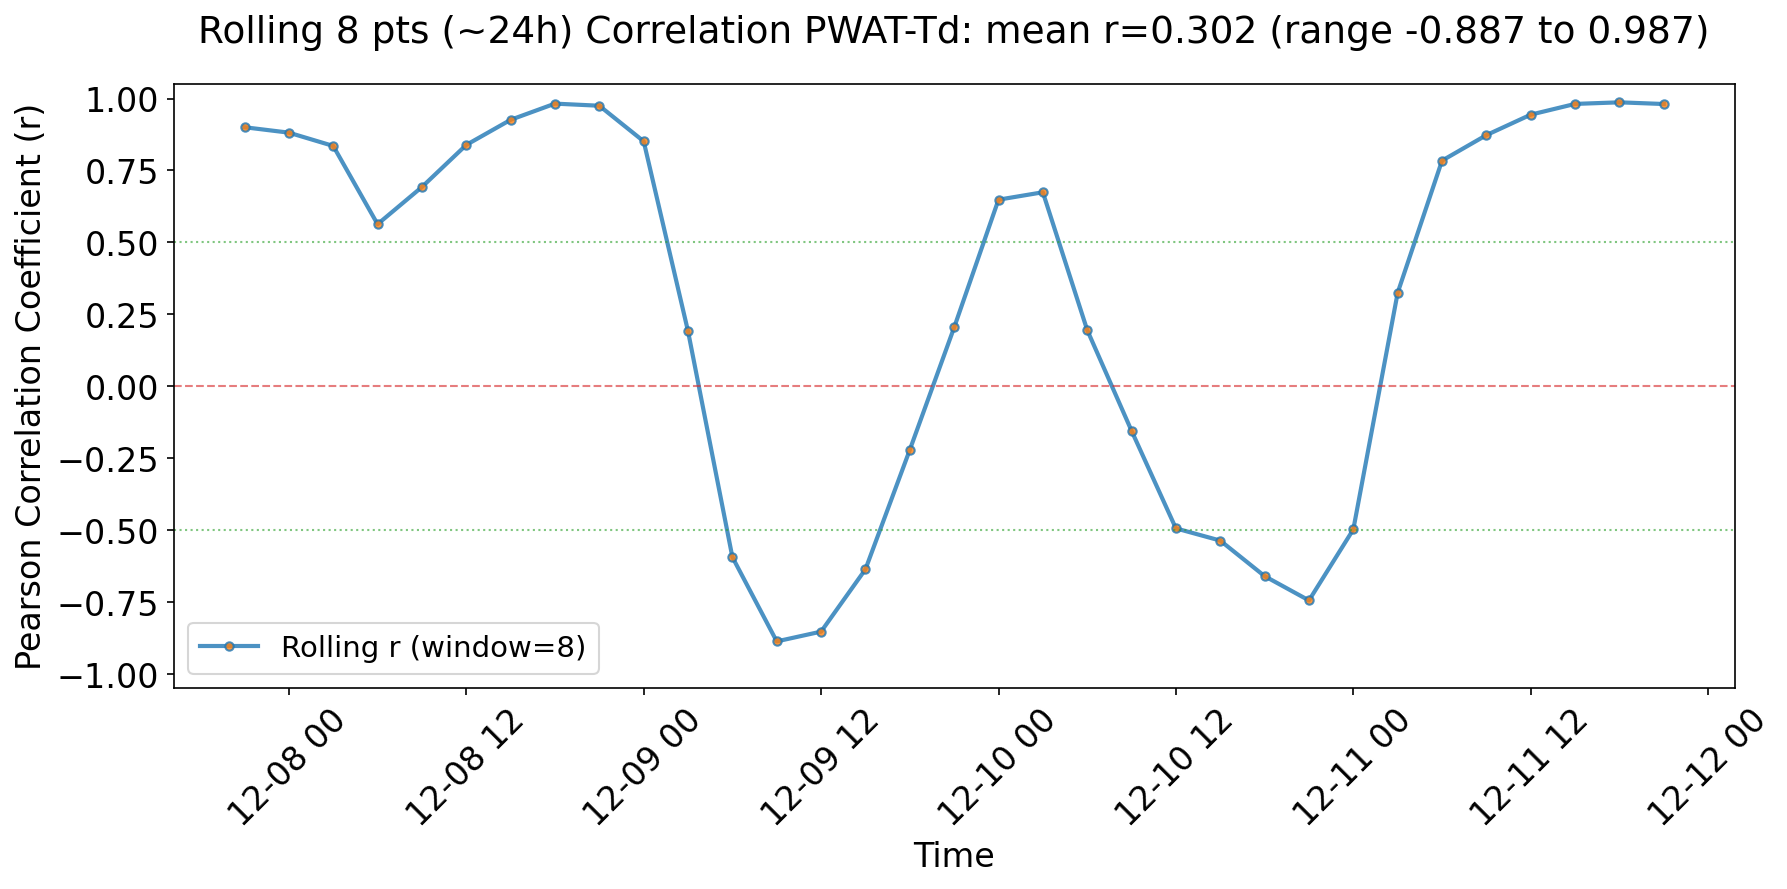
The plot illustrates the temporal evolution of the rolling Pearson correlation coefficient (r) between precipitable water (PWAT, pwatclm) and 2-m dew point temperature (Td, dpt2m) using a window of 8 data points (~24 hours at 3-hourly resolution). Over the short observation period from 2025-12-07 00:00 to 2025-12-08 03:00 (n=10 points), the rolling r values are consistently high and positive, averaging 0.880 with minimal fluctuation (std=0.040), remaining well above the moderate correlation threshold of 0.5. Reference lines highlight r=0 (null correlation) and r=±0.5. The overall dataset correlation is strongly positive at r=0.920 (R²=0.846), indicating that PWAT robustly tracks variations in surface dew point temperature, reflecting coherent moisture dynamics in the atmospheric column and near-surface layer. This stability suggests reliable physical coupling without disruptions, valuable for model evaluation in meteorology or climatology.
Tags
Creator
57343531-6c88-468e-a41a-a14a875e3f74
Published
December 8, 2025
More sharing options
More like this
Similar plots from the gallery.
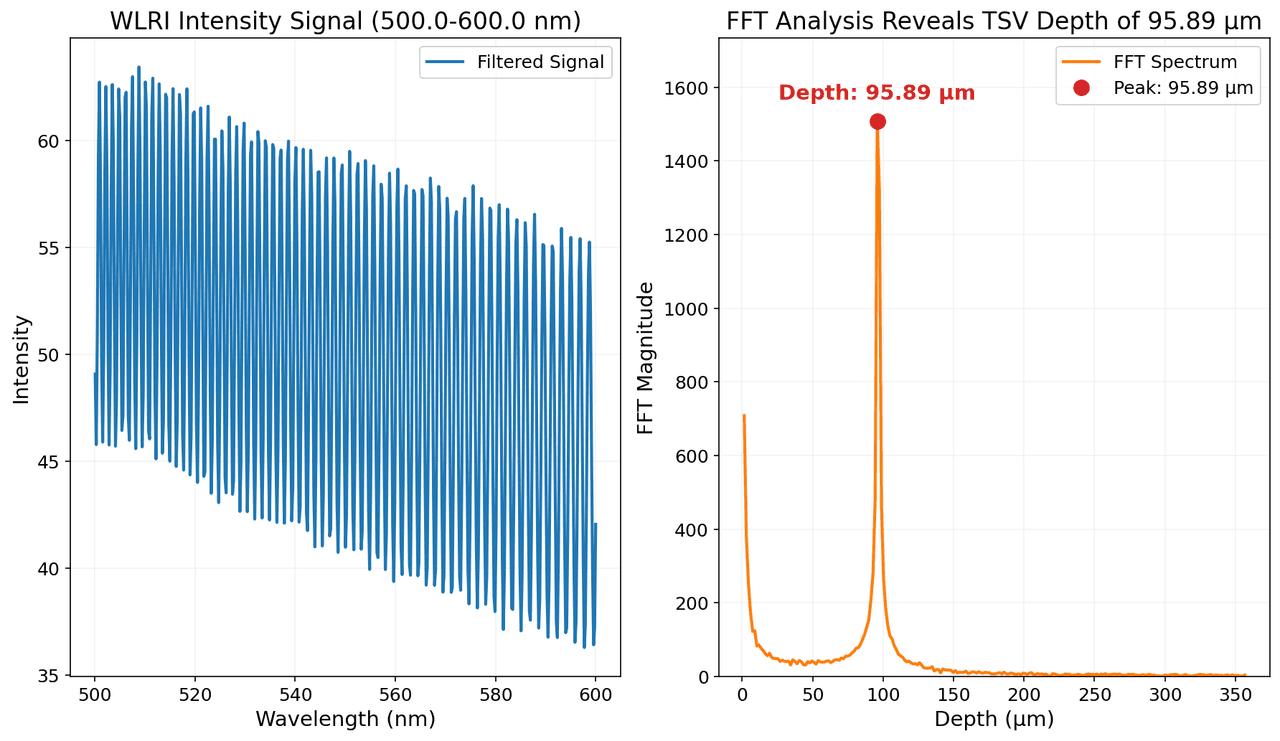
White Light Reflectance Interferometry (WLRI) intensity spectrum and corresponding Fast Fourier Transform (FFT) analysis.
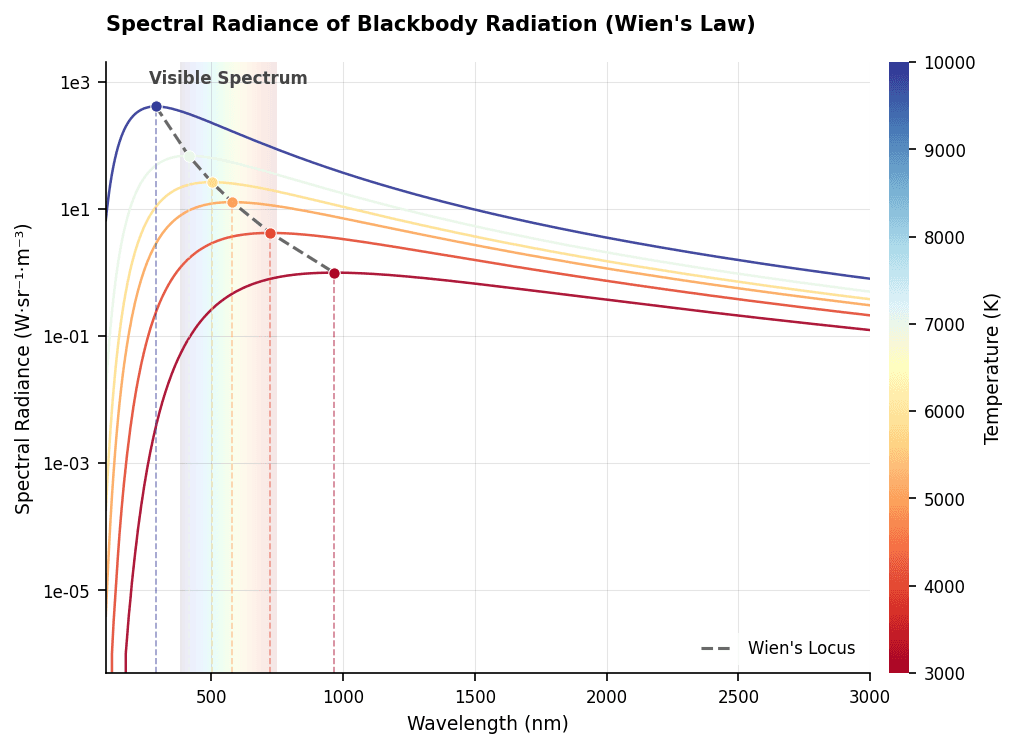
Spectral radiance of blackbody radiation as a function of wavelength for temperatures ranging from cool (red) to hot (blue).
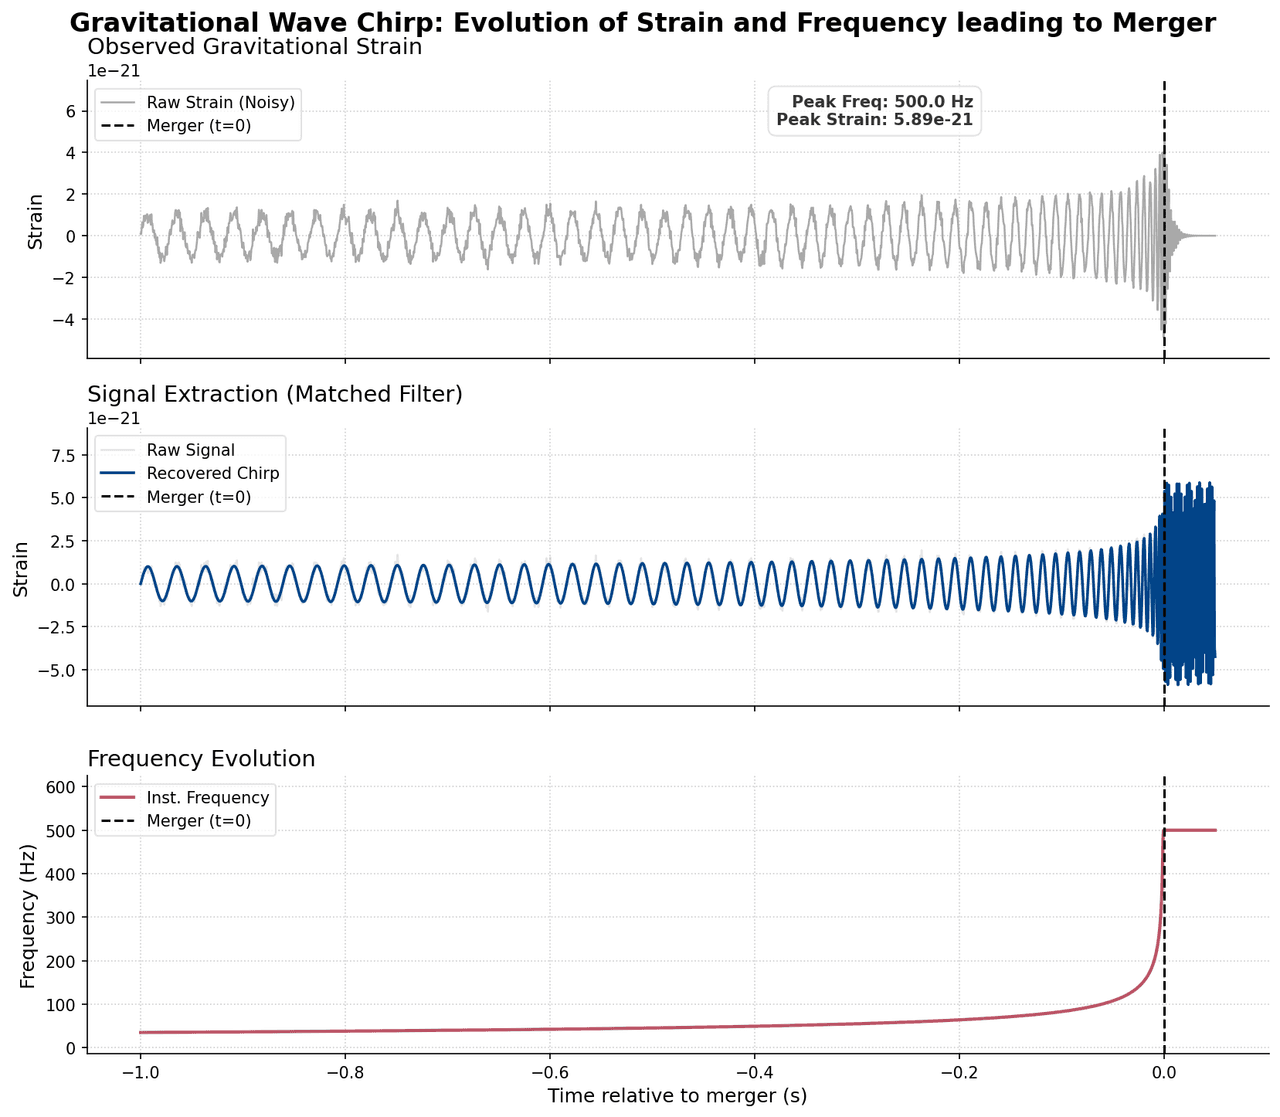
Gravitational waves
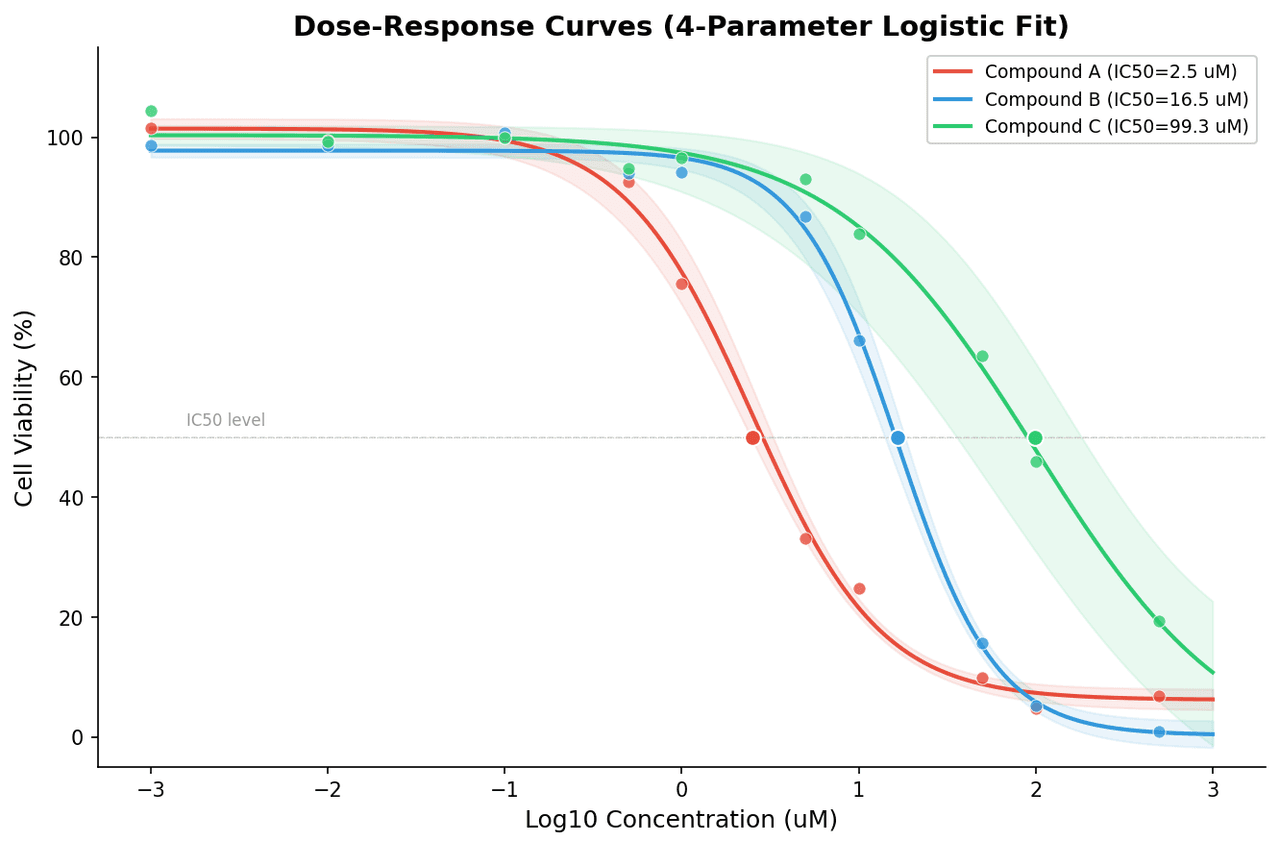
Dose-response curves for three experimental compounds
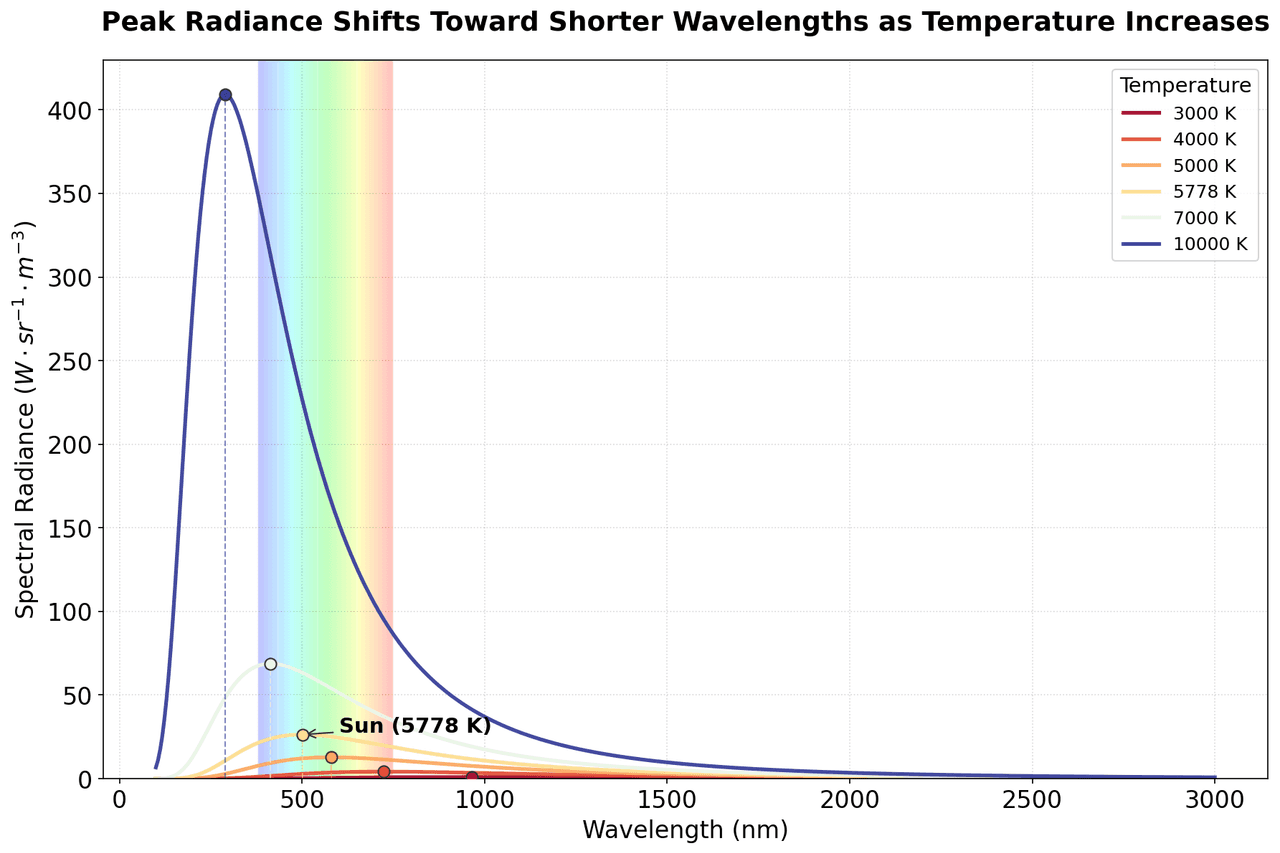
Spectral radiance is plotted as a function of wavelength for black bodies at various temperatures