Menu
Refer a Friend
Share your link — earn +15 permanent plots for every friend who joins.
Sign in to get your referral linkmatplotlibother
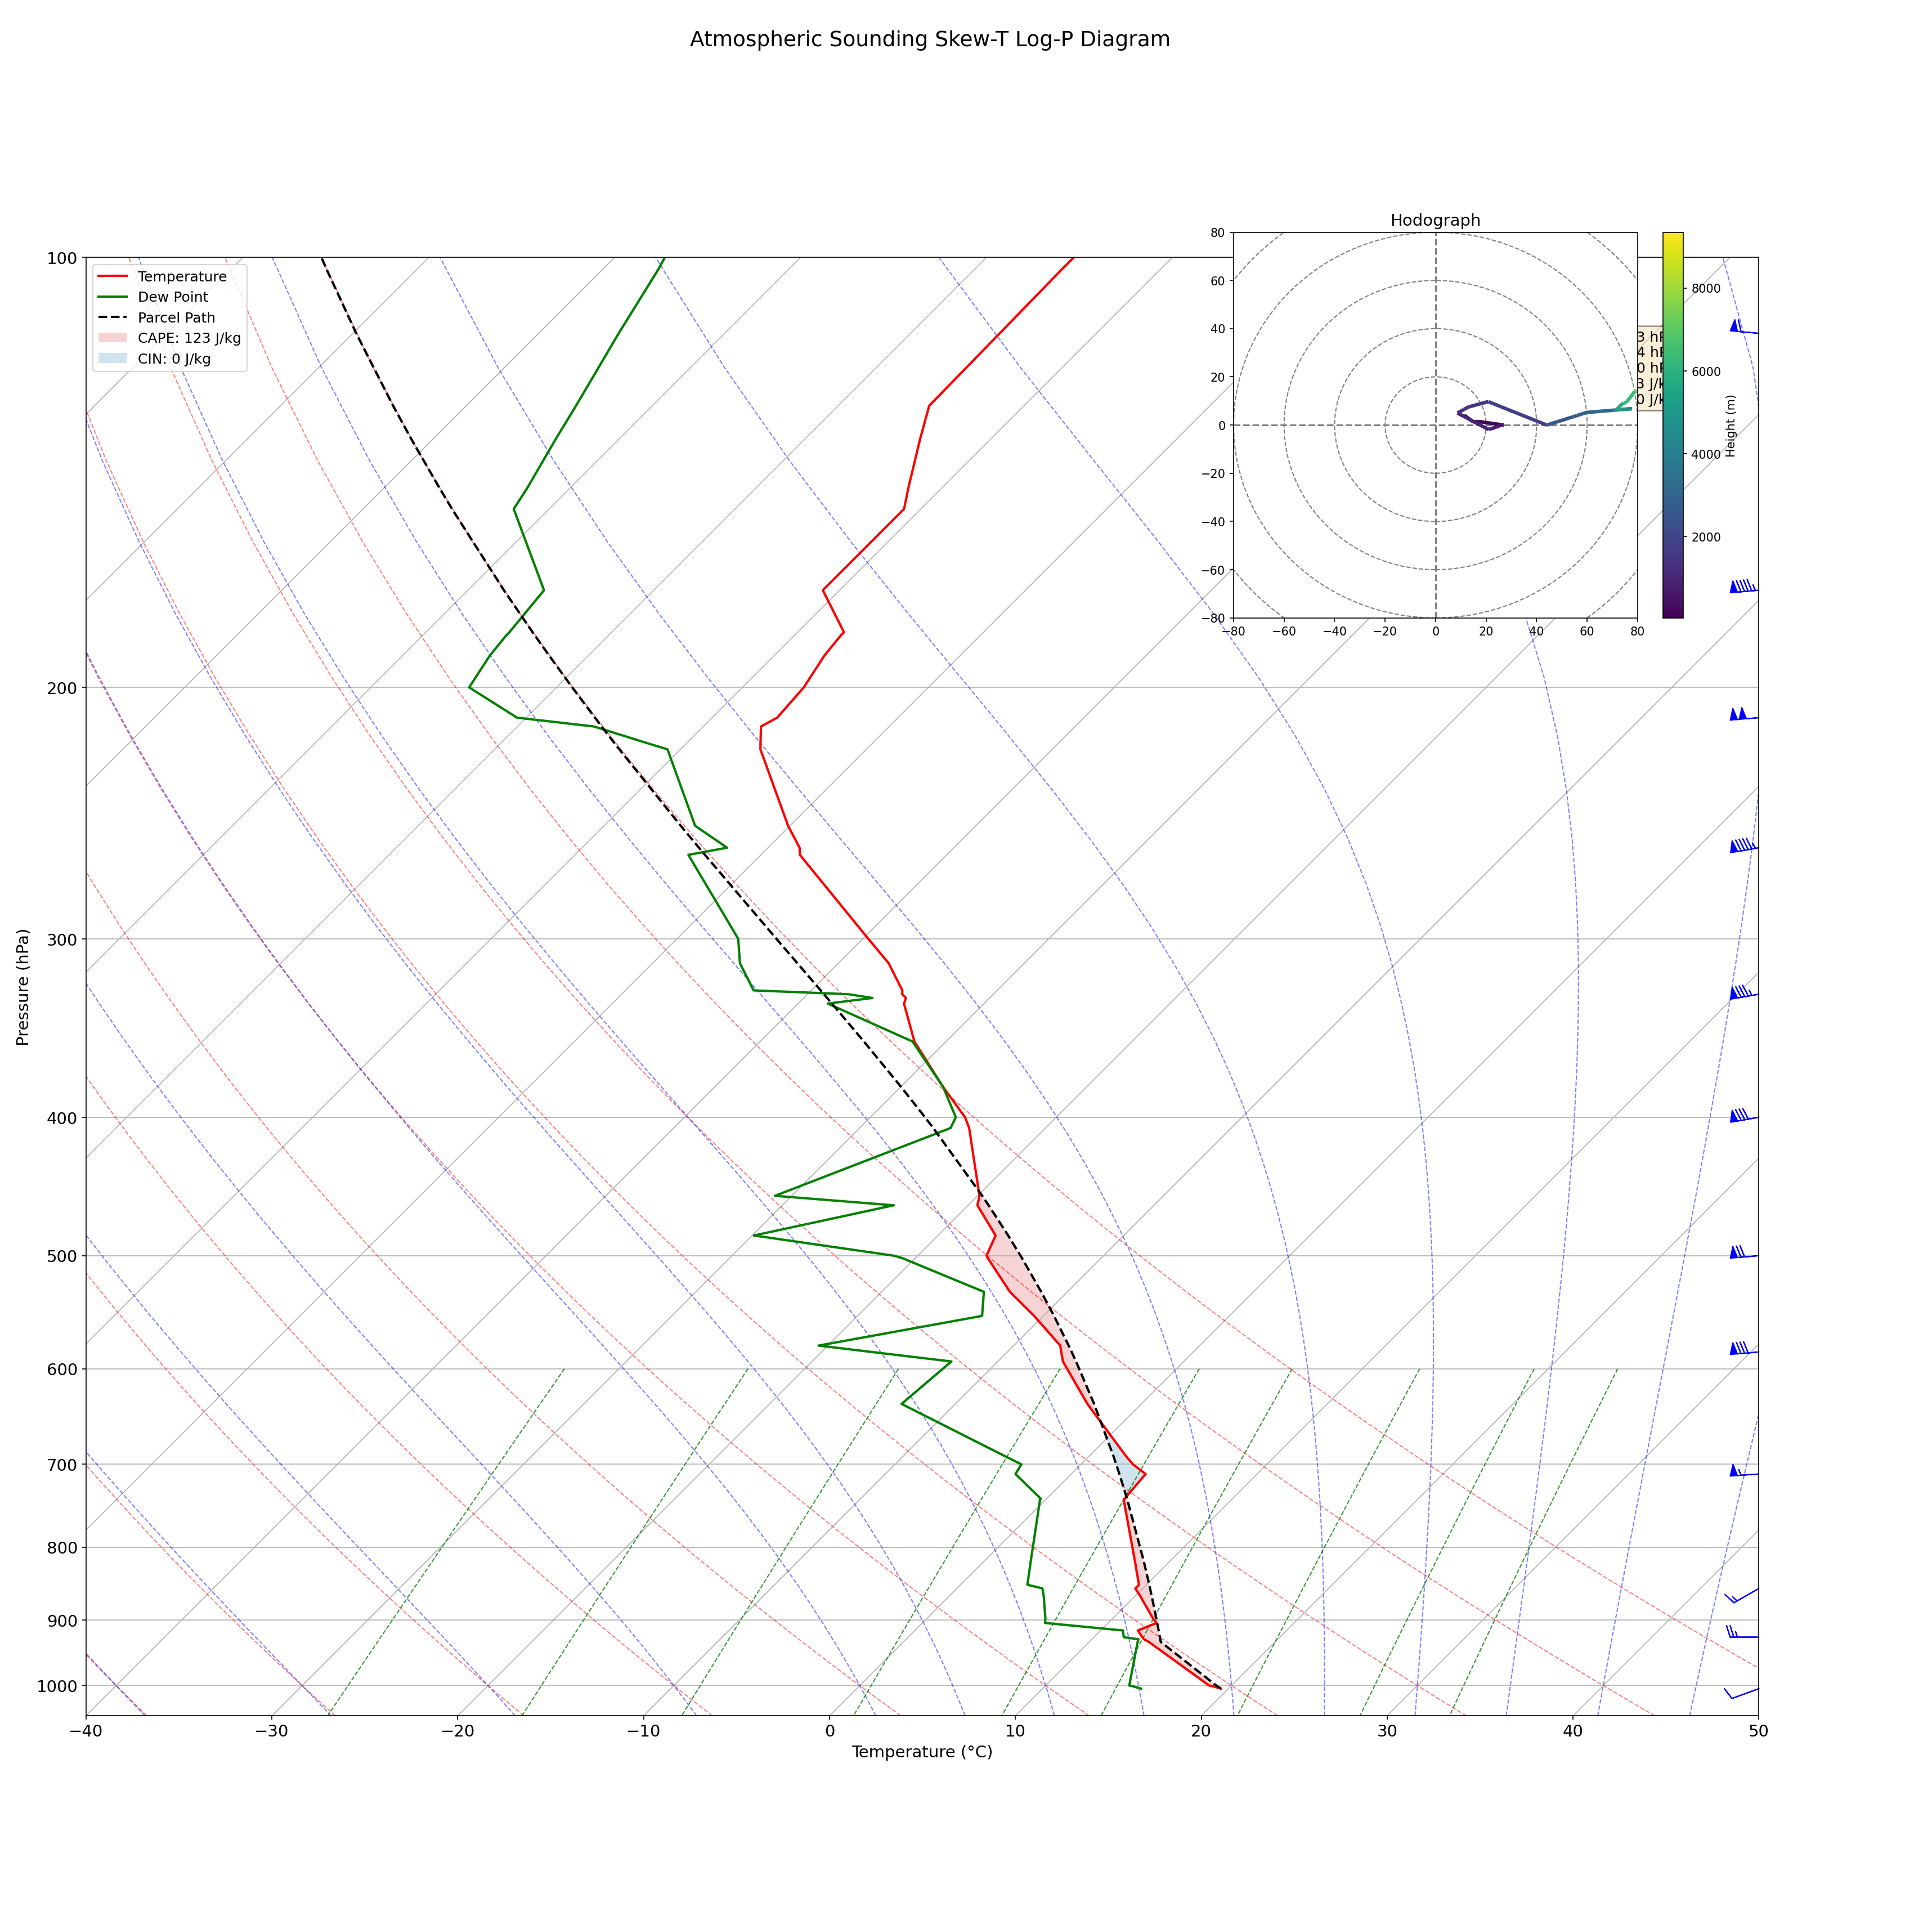
Skew-t Log-p
Description
Skew-T log-P diagram showing vertical profiles of temperature, dew point temperature, and wind from a sounding. The temperature and dew point profiles are plotted in degrees Celsiusagainst pressure in hPa.
0
Creator
anonymous
Published
October 26, 2025
More sharing options
More like this
Similar plots from the gallery.

matplotlibother
Dashboard
00
matplotlibother
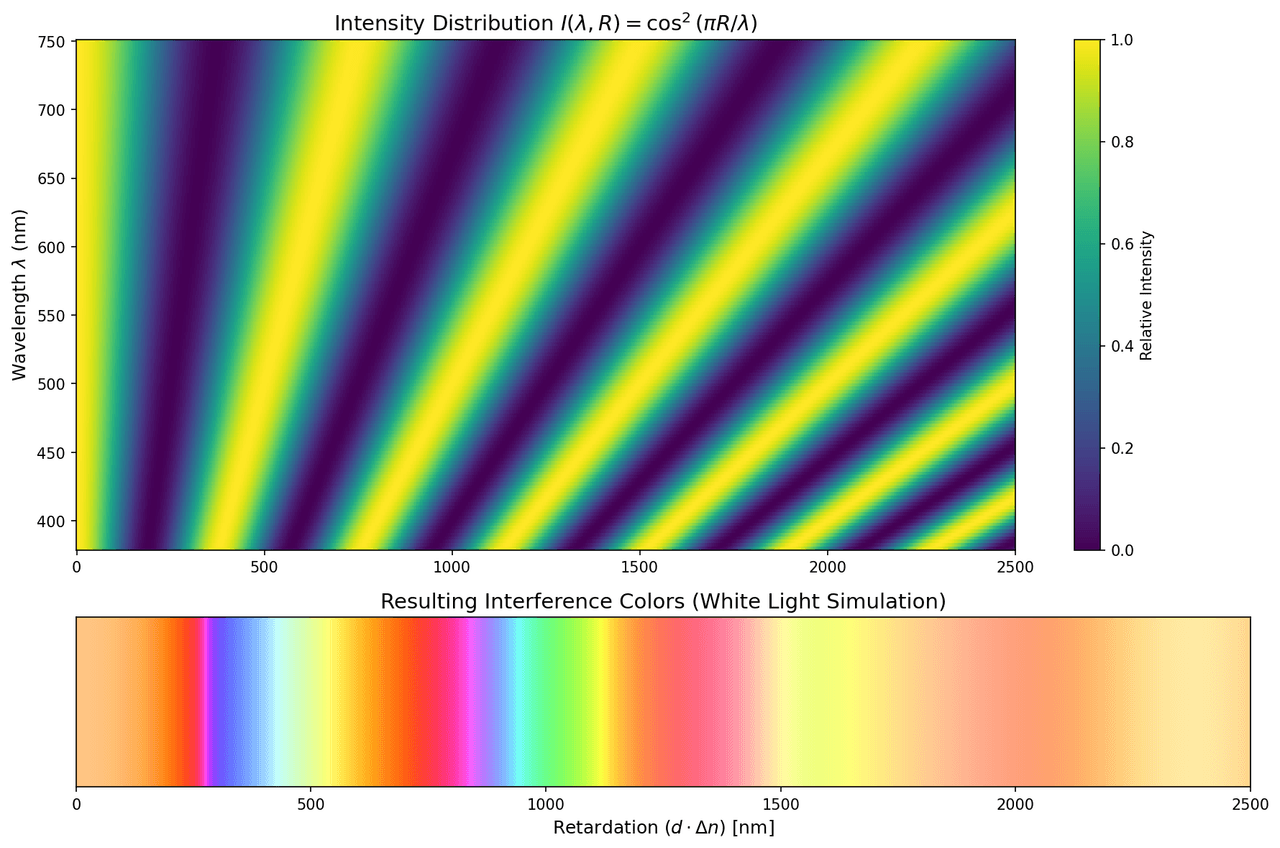
Variation of light intensity as a function of birefringence
10
matplotlibother
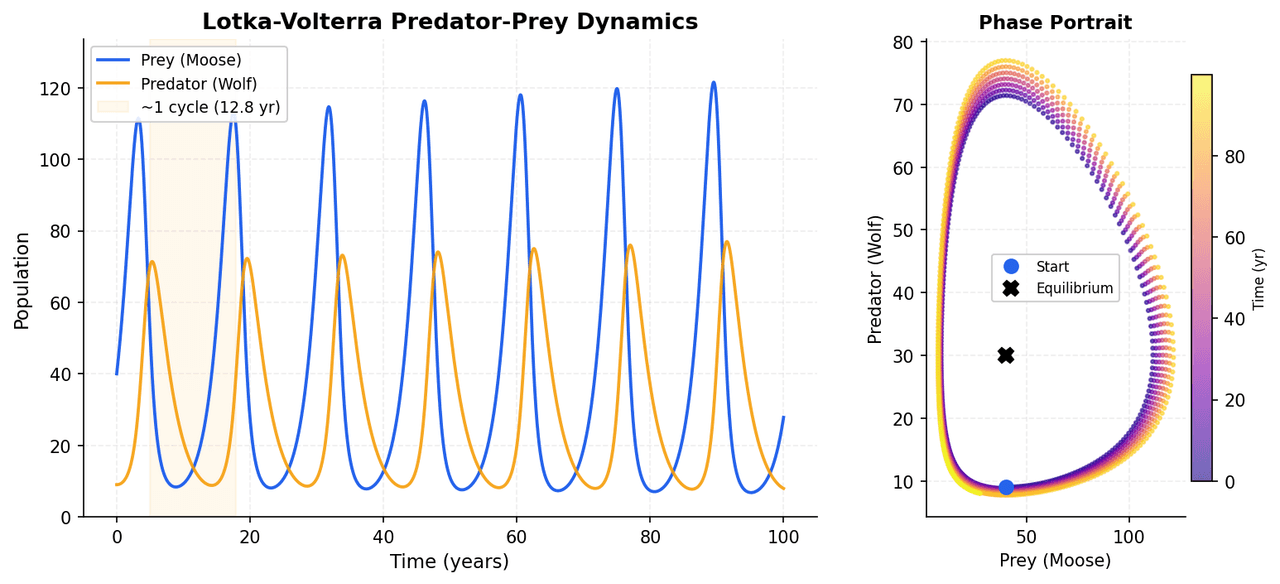
Population dynamics of a predator-prey system
10
matplotlibother
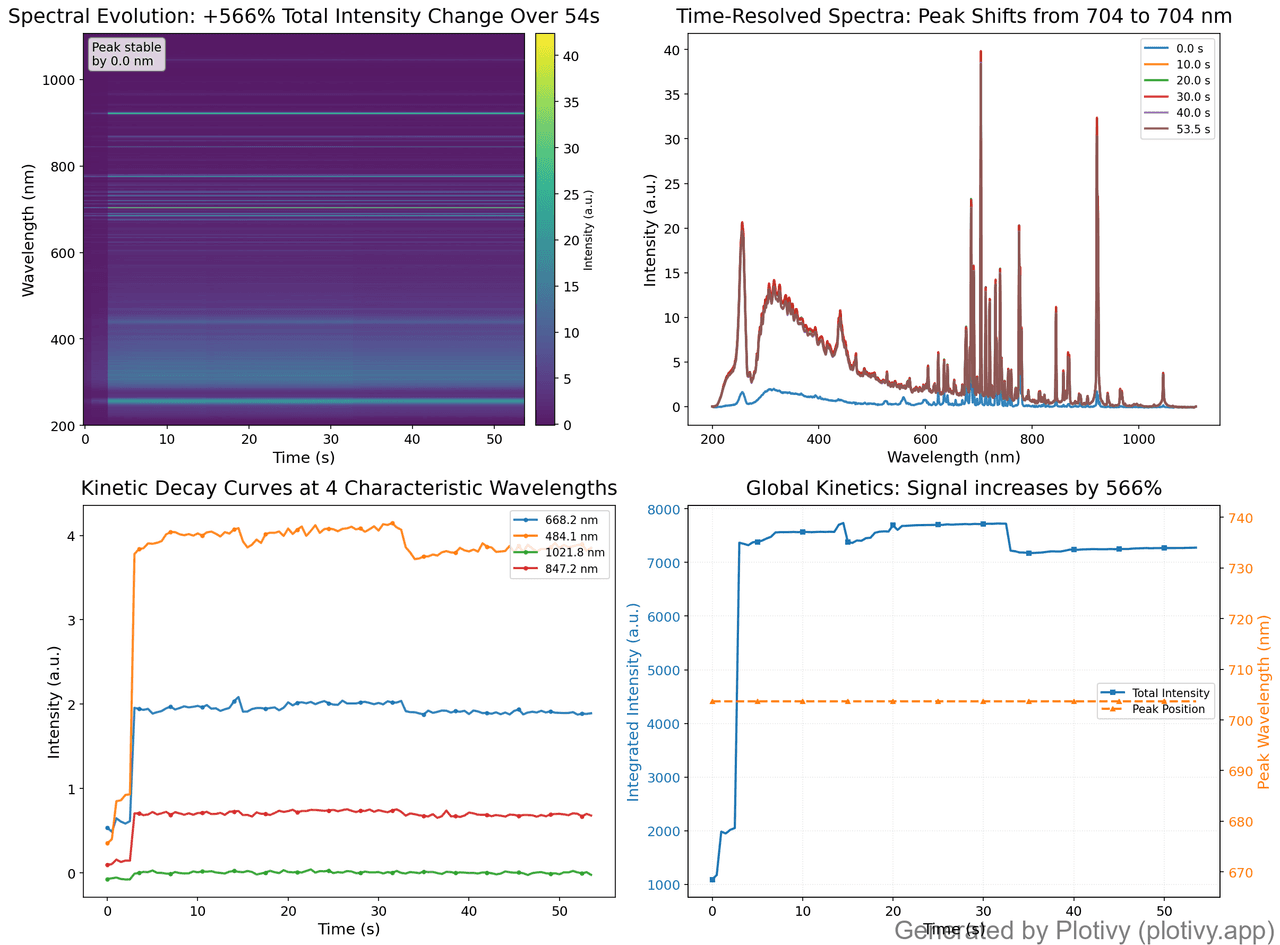
Comprehensive spectroscopic dashboard
11
matplotlibother
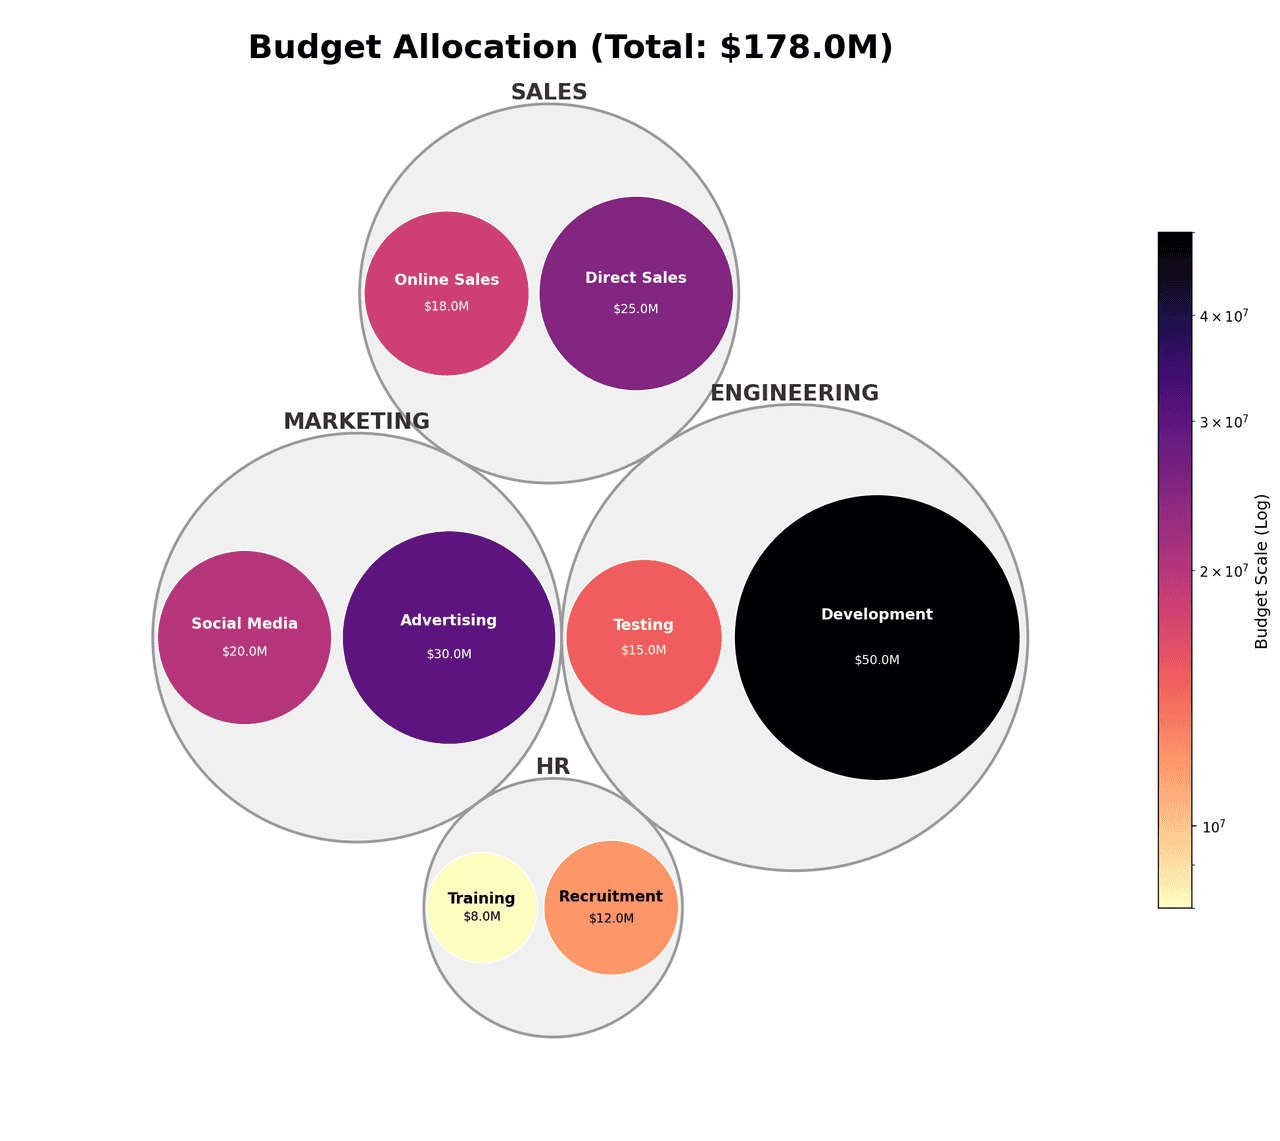
Hierarchical bubble chart
00
plotlyother
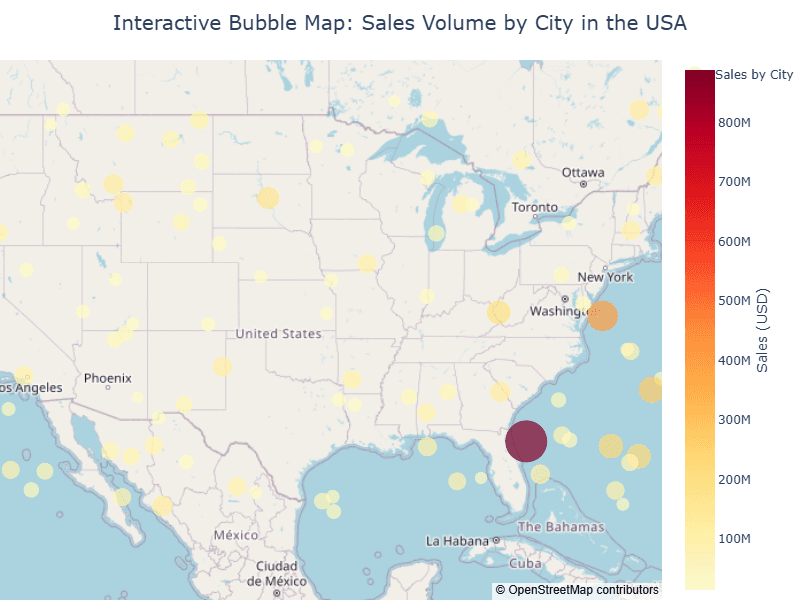
Example Interactive Bubble map
01