Menu
Refer a Friend
Share your link — earn +15 permanent plots for every friend who joins.
Sign in to get your referral linkmatplotlibline
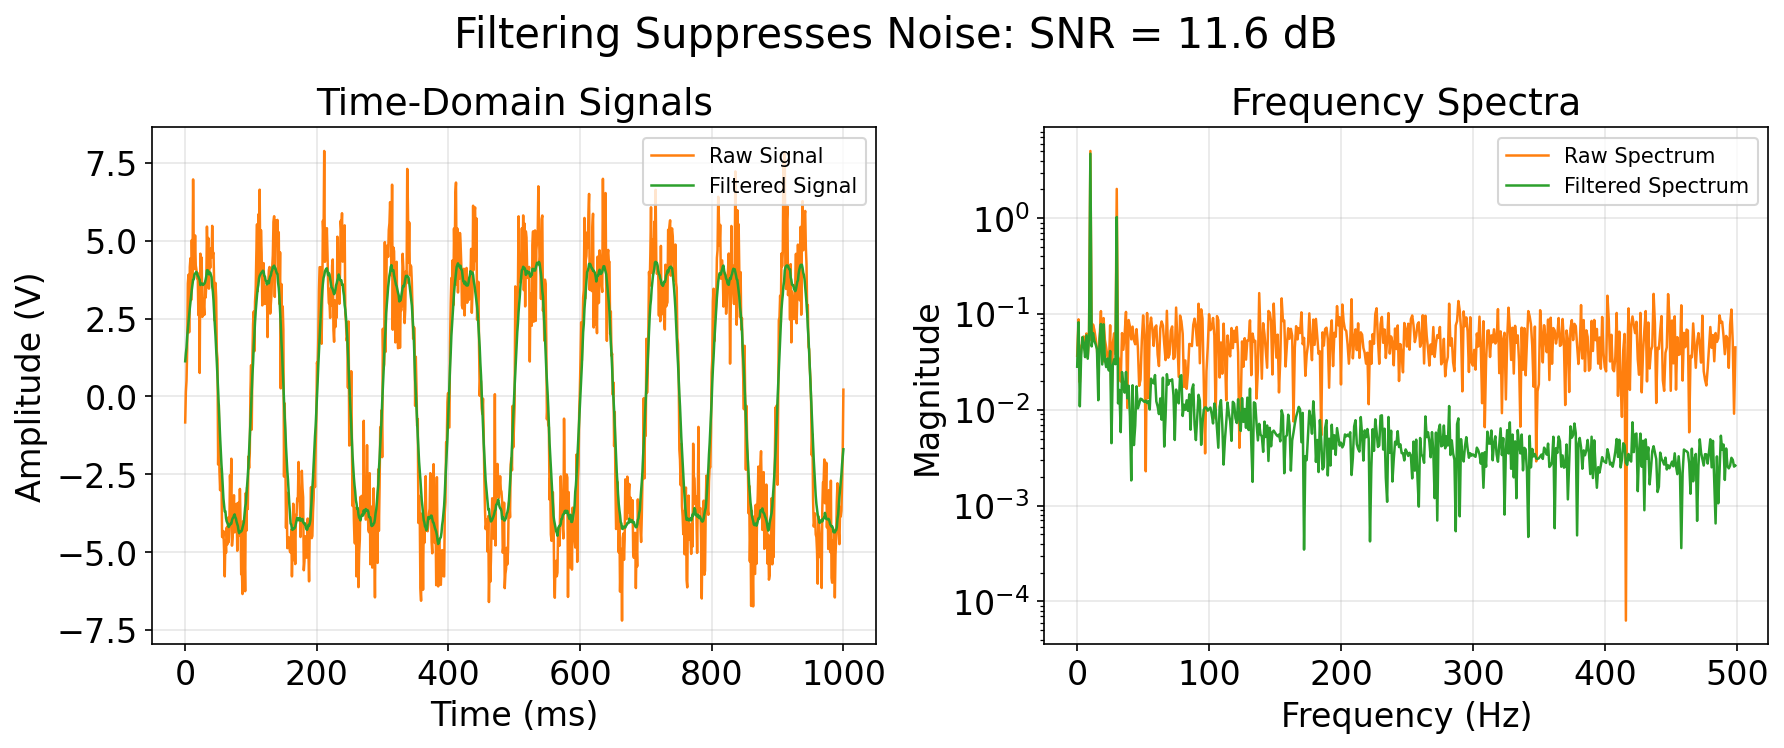
Time- and frequency-domain views of raw (orange) and filtered (green) signals
Description
Time- and frequency-domain views of raw (orange) and filtered (green) signals illustrate substantial noise suppression by the filter, particularly in higher frequencies. The average signal-to-noise ratio across the dataset is 11.6 dB.
Tags
#code#data available#line#scientific
0
Creator
85575894-8803-4260-9370-289a4b586346
Published
November 20, 2025
More sharing options
More like this
Similar plots from the gallery.
matplotlibline
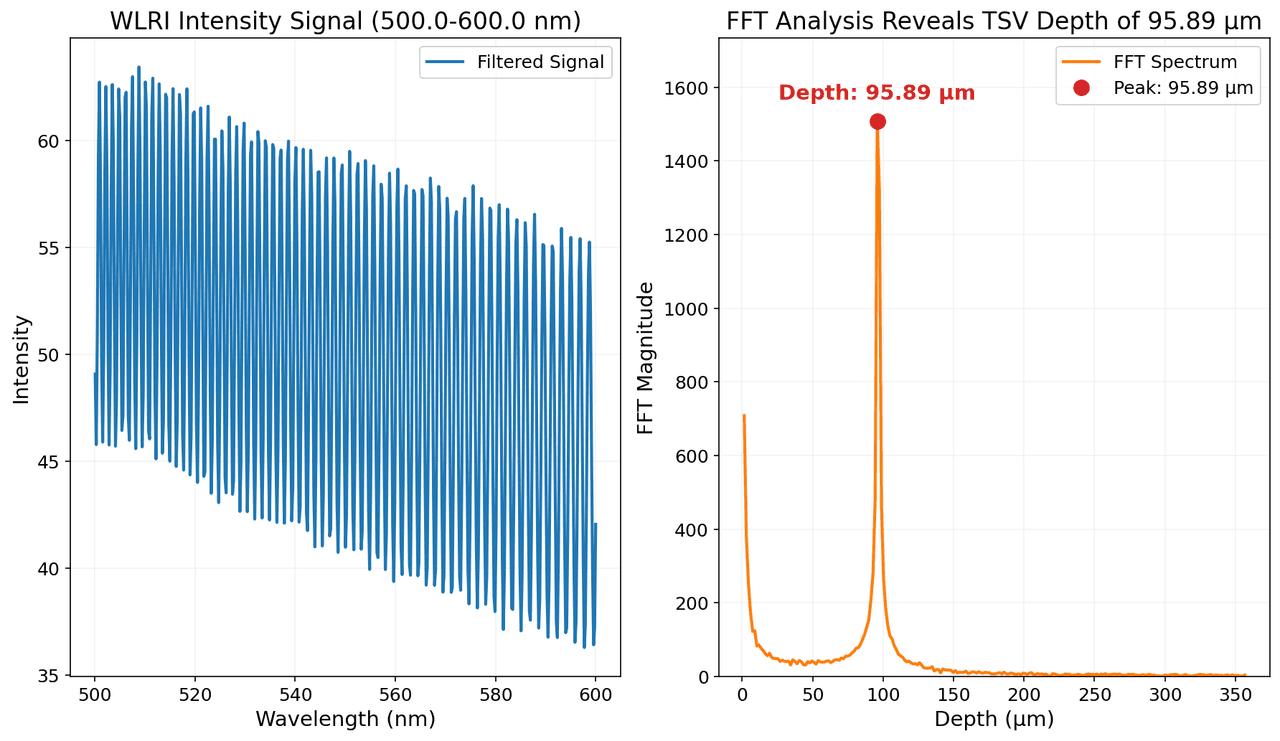
White Light Reflectance Interferometry (WLRI) intensity spectrum and corresponding Fast Fourier Transform (FFT) analysis.
11
matplotlibline
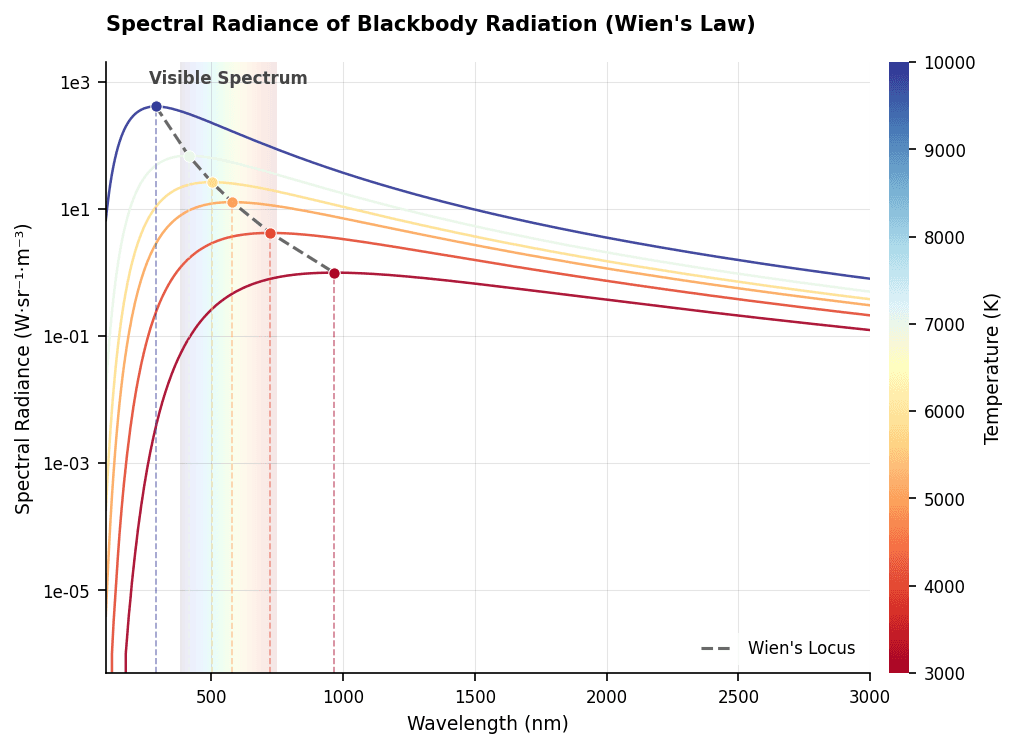
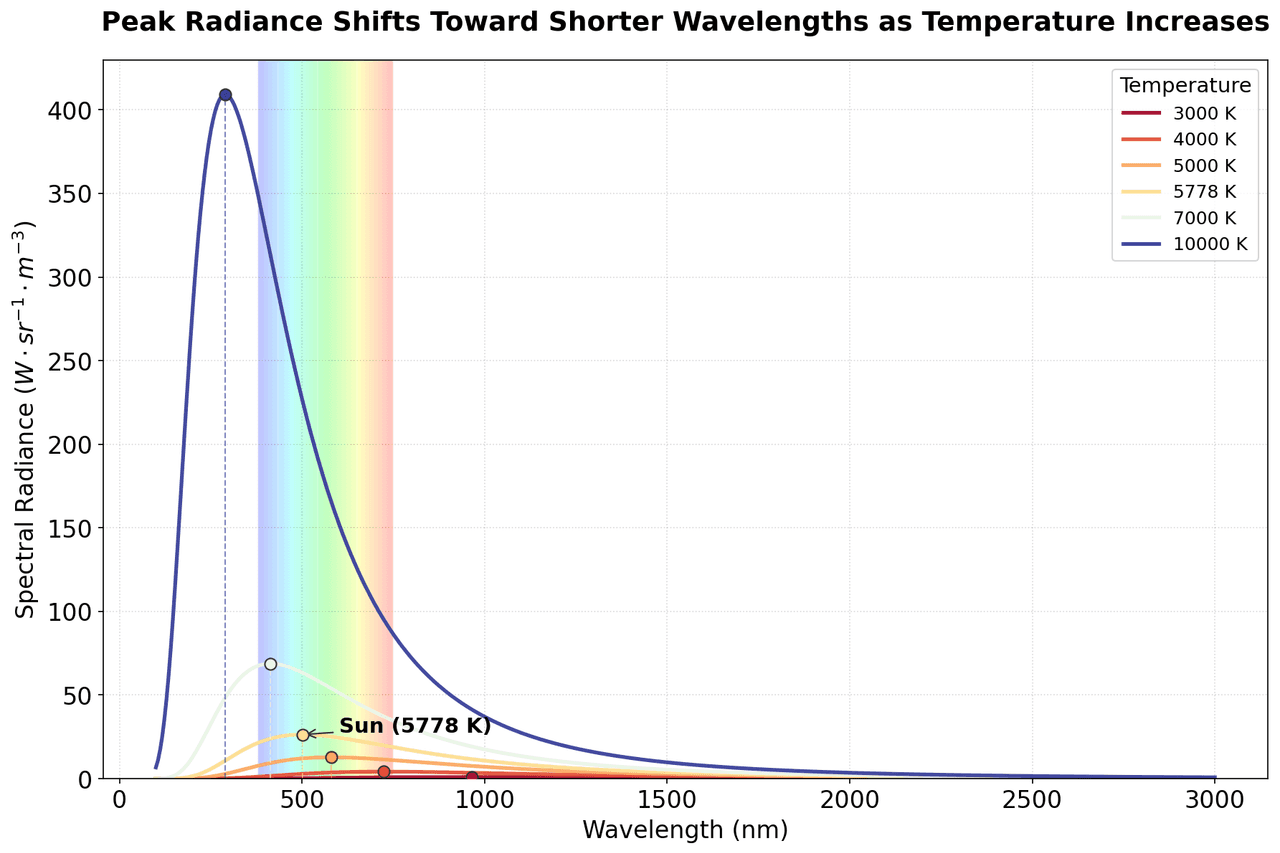
Spectral radiance of blackbody radiation as a function of wavelength for temperatures ranging from cool (red) to hot (blue).
00
matplotlibline
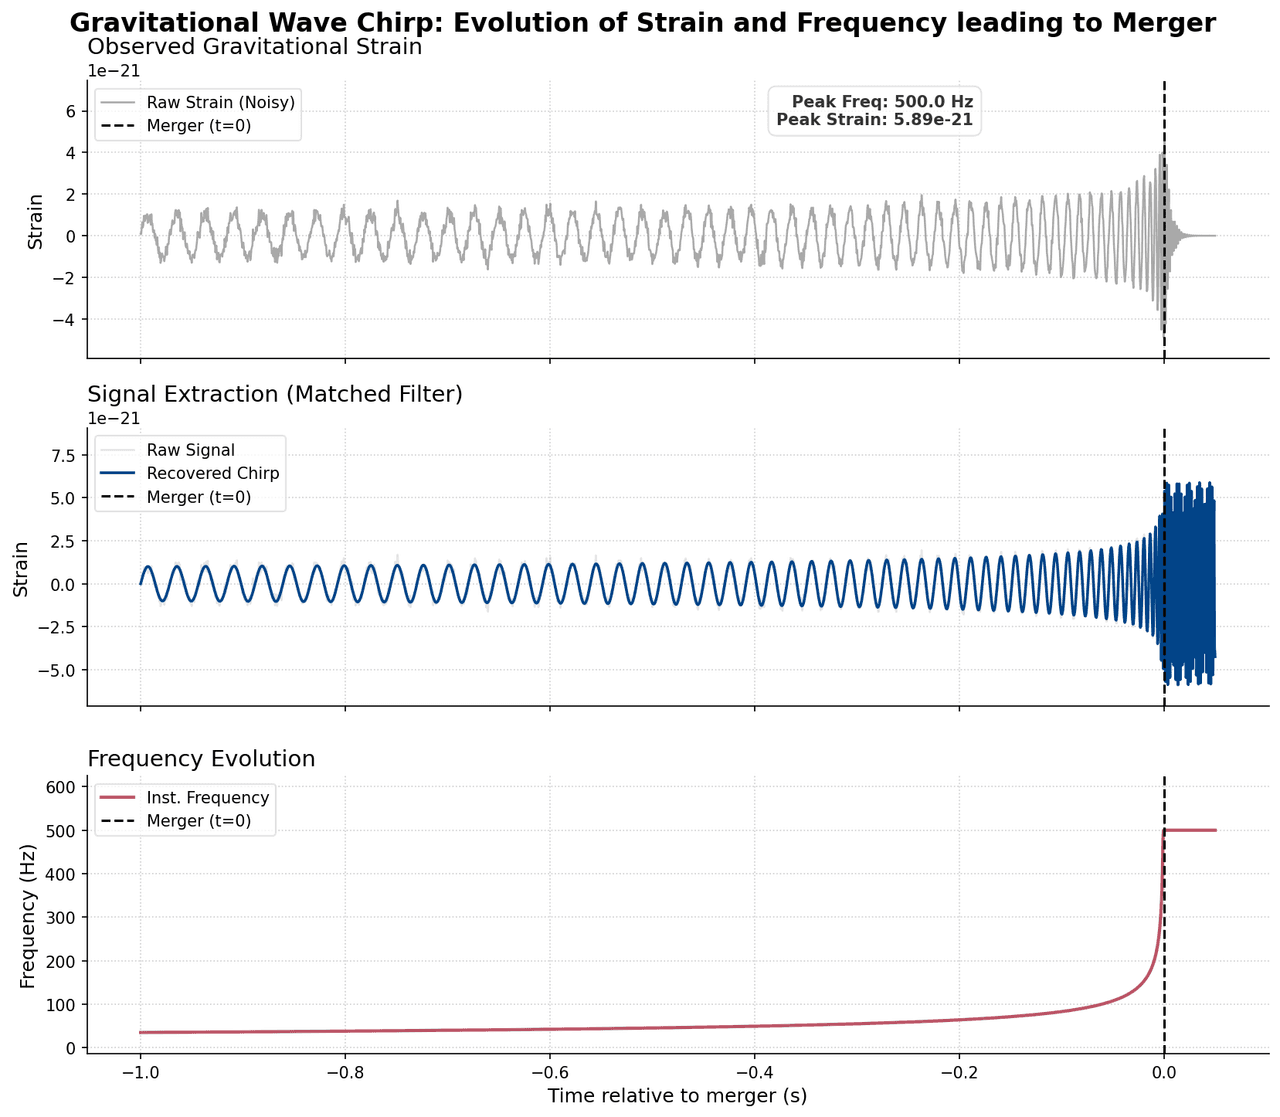
Gravitational waves
00
matplotlibline
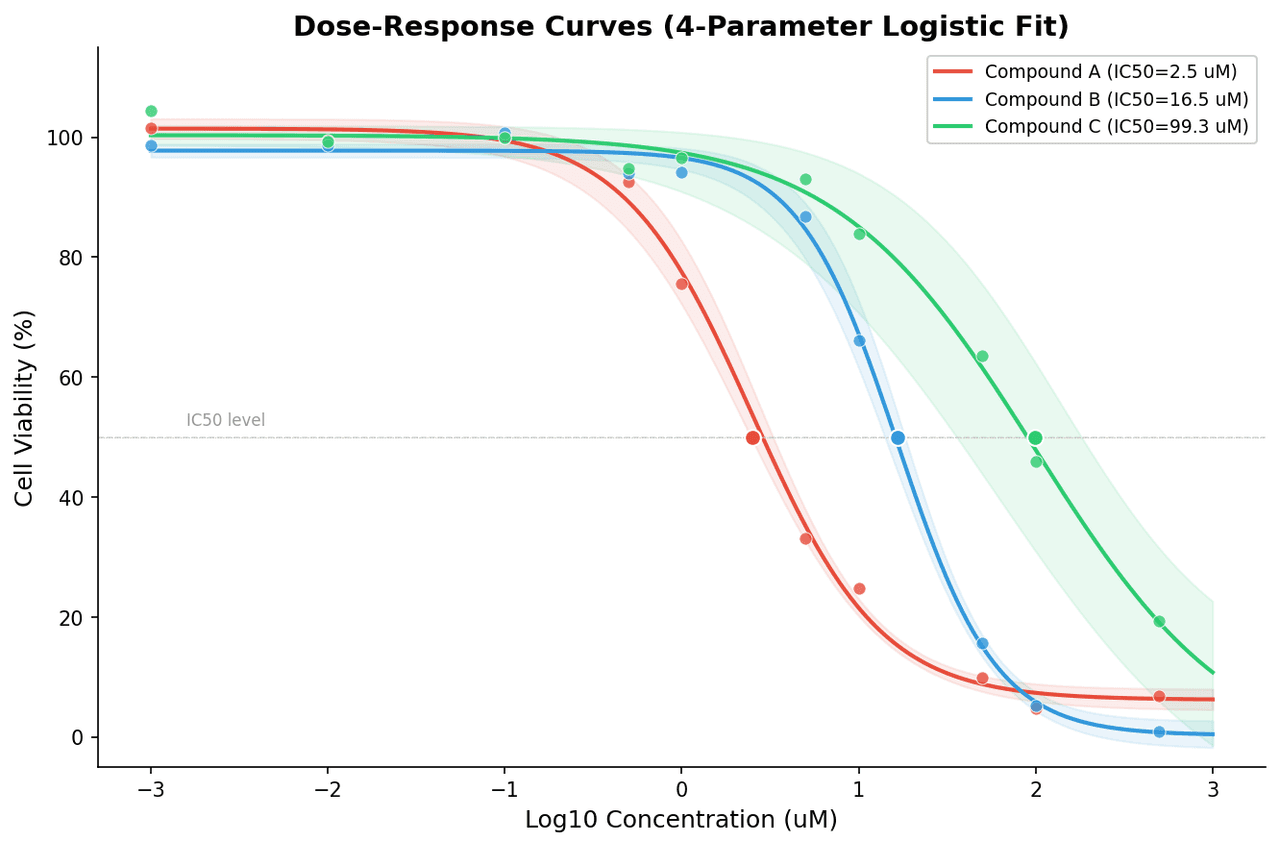
Dose-response curves for three experimental compounds
00
matplotlibline
Spectral radiance is plotted as a function of wavelength for black bodies at various temperatures
11
matplotlibline
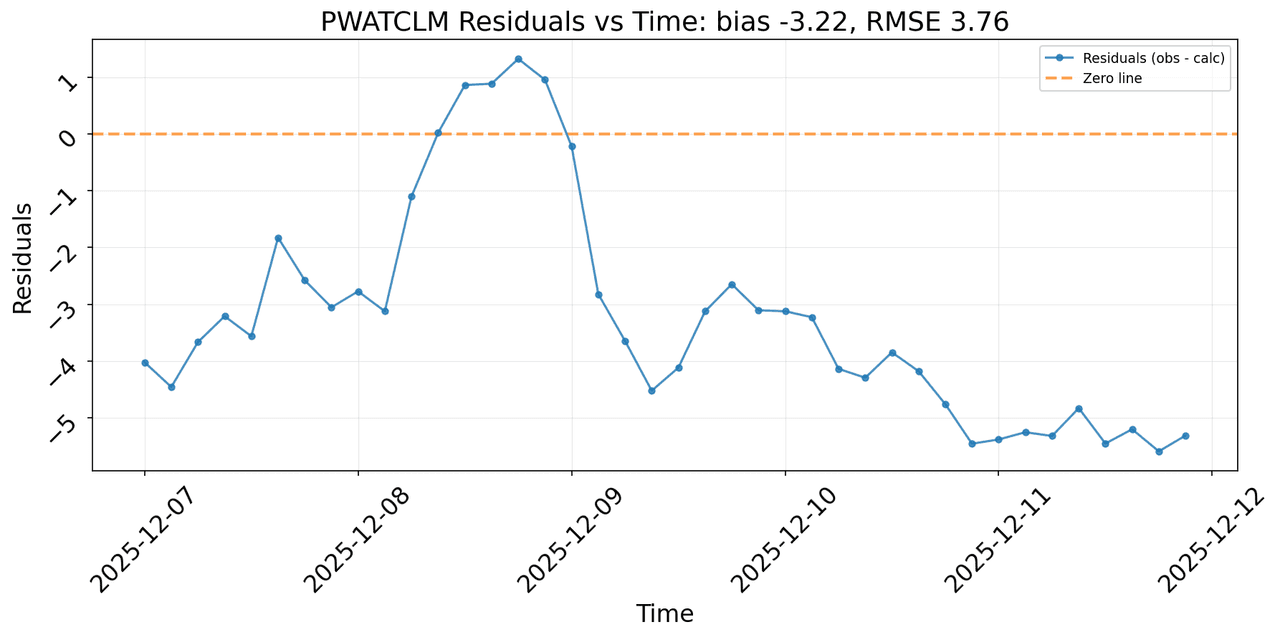
Time series of Precipitable Water residuals (observed minus calculated from 2-m dew point temperature) for 2025-12-07 to 2025-12-08.
00