Menu
Refer a Friend
Share your link — earn +15 permanent plots for every friend who joins.
Sign in to get your referral linkGaussen Aridity Index.
Description
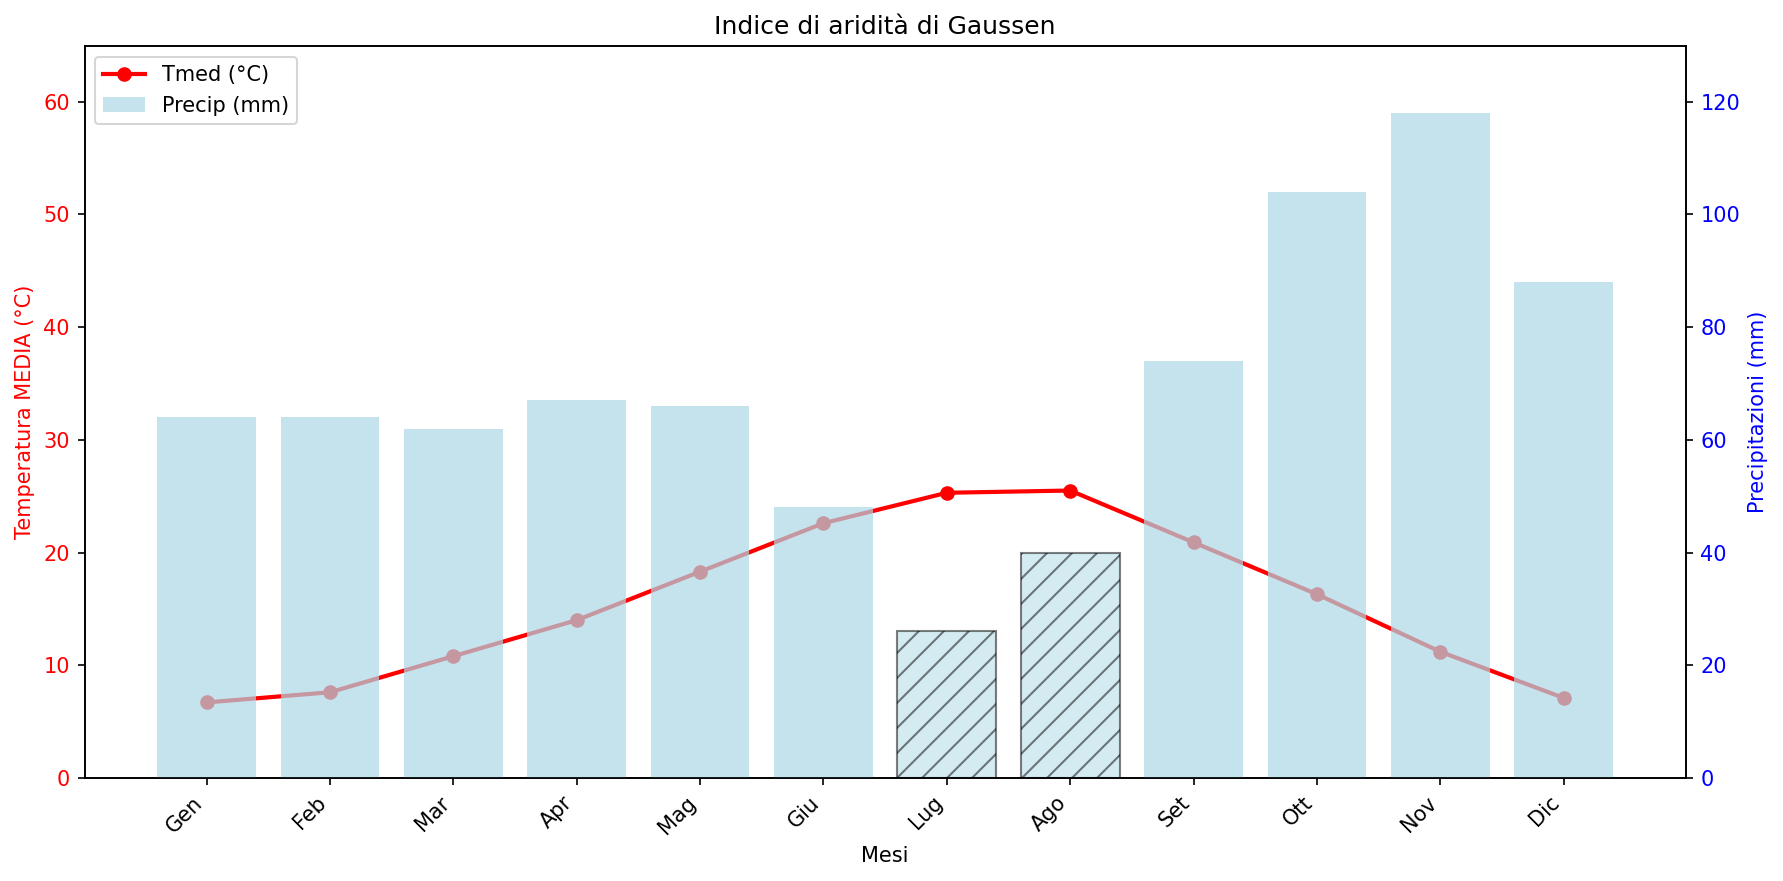
Ombrothermic diagram according to the Gaussen aridity index.The chart illustrates the monthly climatic trend, comparing the mean temperatures (Tmed, red line, °C, left-hand axis) with the total precipitation (Precip, light blue bars, mm, right-hand axis).The diagram is constructed following Gaussen's rule, wherein the precipitation scale (mm) is double that of the temperature scale (°C), according to the P = 2T relationship. This configuration is essential for visually identifying the period of aridity.The arid period occurs when the temperature curve is positioned above the precipitation bars (P < 2T). In this specific case, the months of July and August, indicated by hatching, represent the year's arid period.
Creator
anonymous
Published
October 23, 2025
More sharing options
More like this
Similar plots from the gallery.
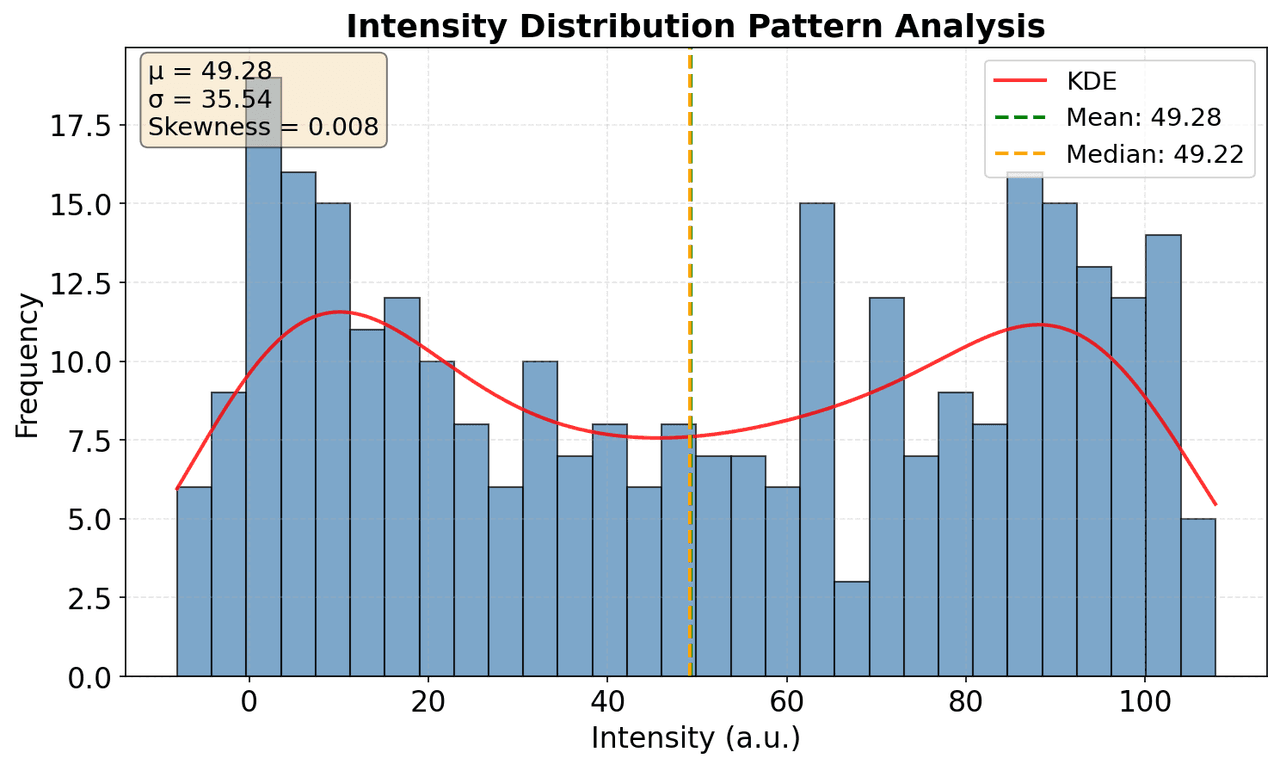
Plot histogram of Intensity distribution to understand pattern characteristics
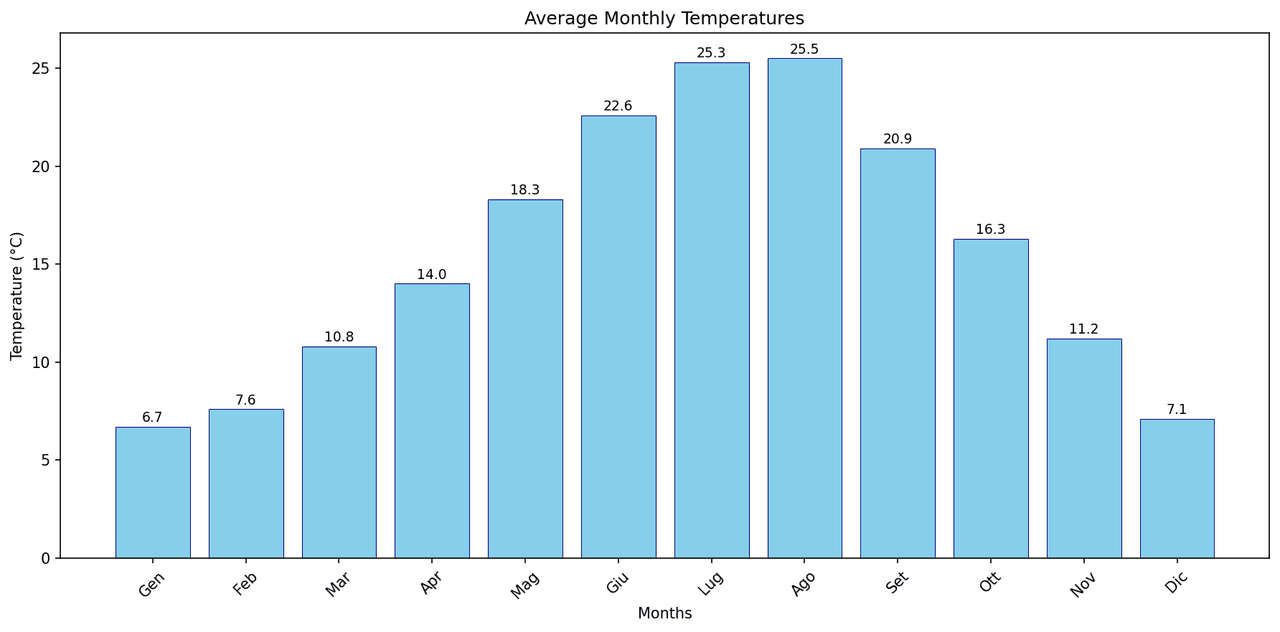
3. Create a bar plot of months (x-axis) vs Tmed MEDIA values (y-axis) to compare average monthly tem
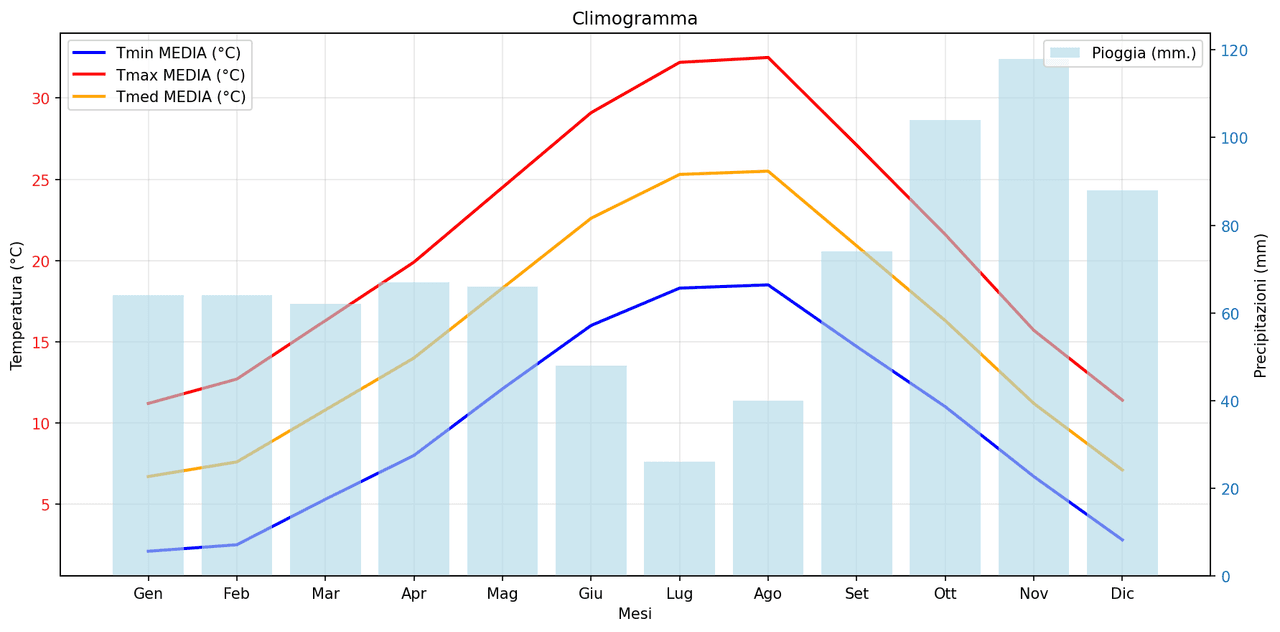
Climogramma di Firenze (Italia)

Accuracy (%) at pass @1 across different ChatGPT models.