Menu
Refer a Friend
Share your link — earn +15 permanent plots for every friend who joins.
Sign in to get your referral linkmatplotlibhistogram
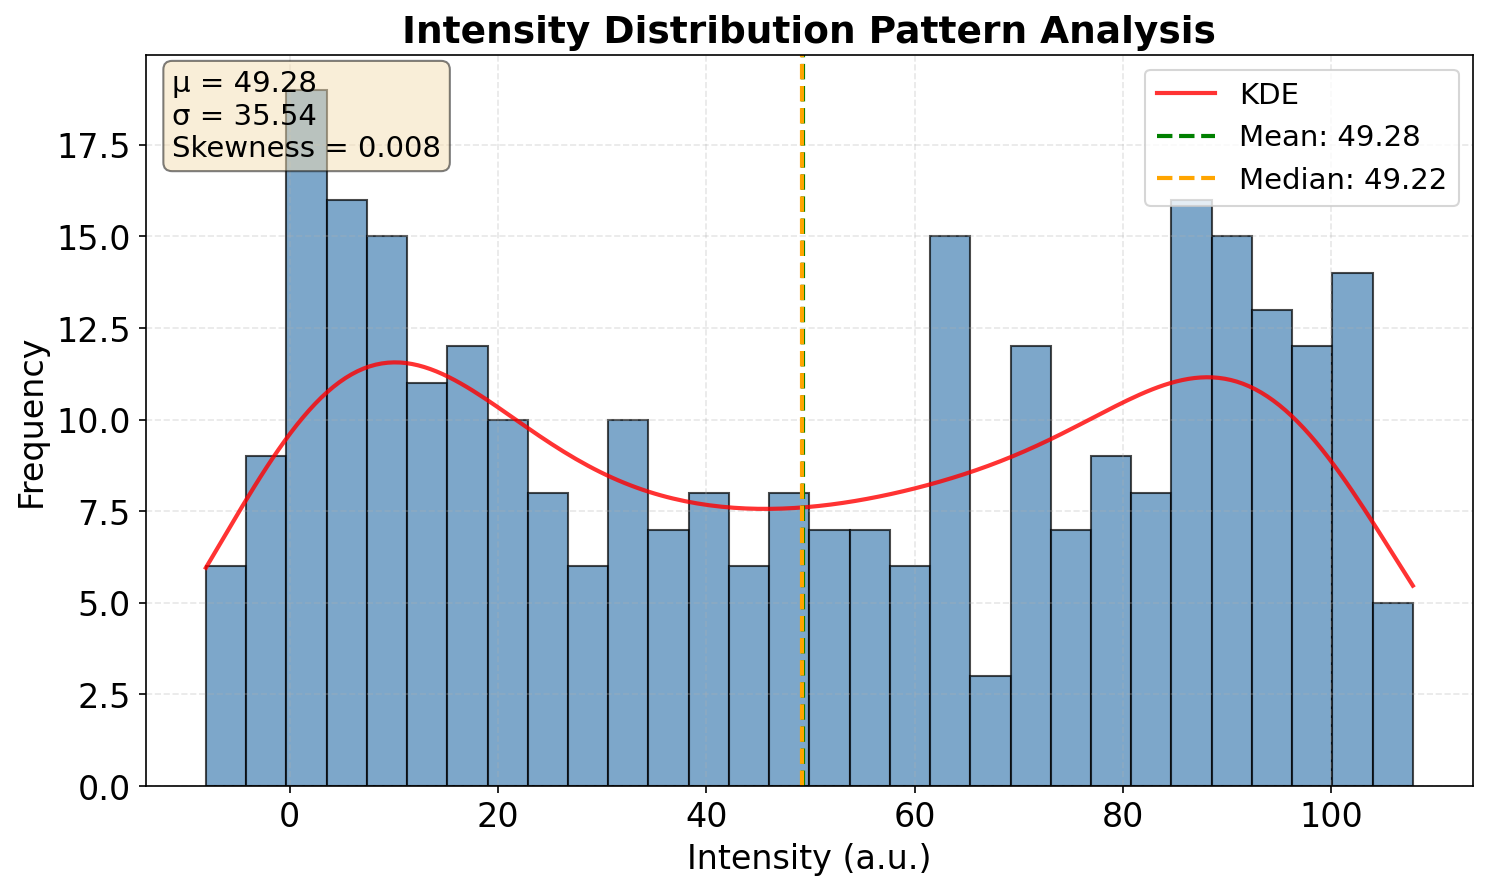
Plot histogram of Intensity distribution to understand pattern characteristics
Description
This plot does not include a description yet.
Tags
#code#data available
0
Creator
anonymous
Published
November 1, 2025
More sharing options
More like this
Similar plots from the gallery.
matplotlibhistogram
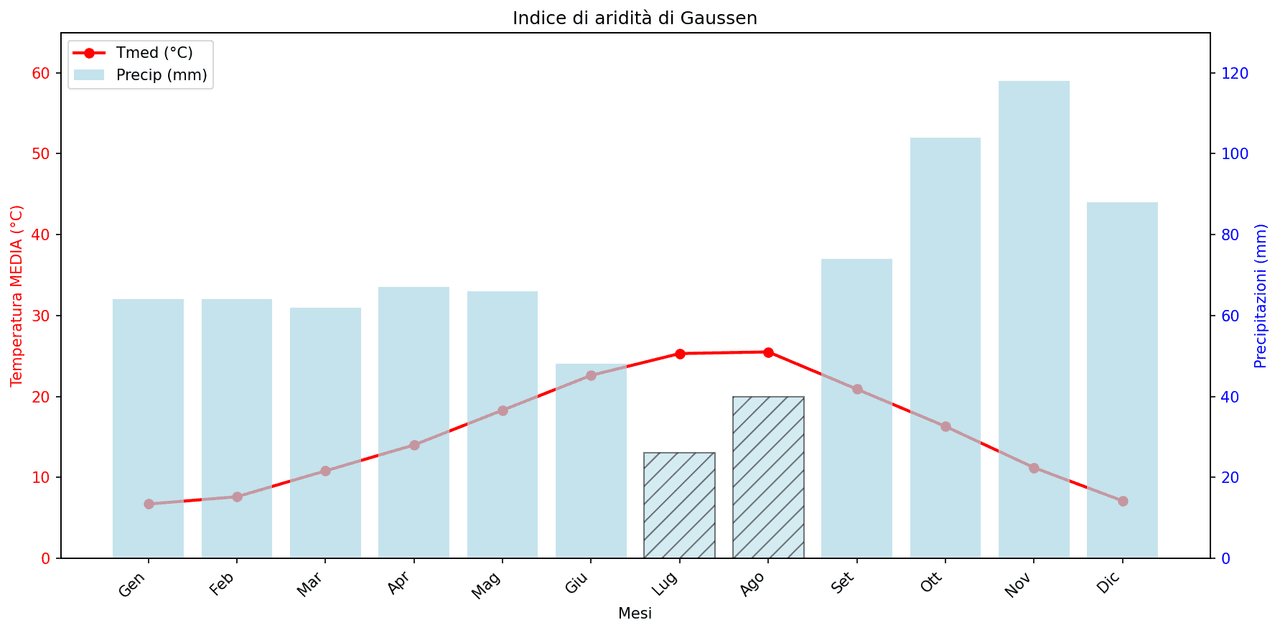
Gaussen Aridity Index.
00
matplotlibhistogram
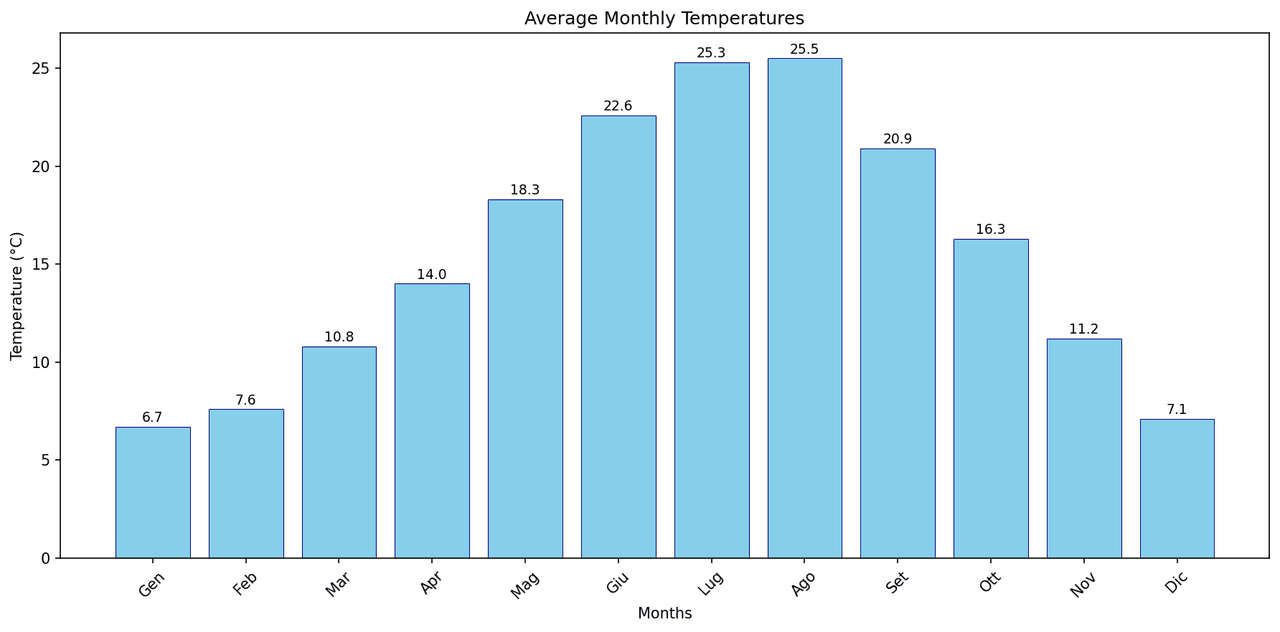
3. Create a bar plot of months (x-axis) vs Tmed MEDIA values (y-axis) to compare average monthly tem
10
matplotlibhistogram
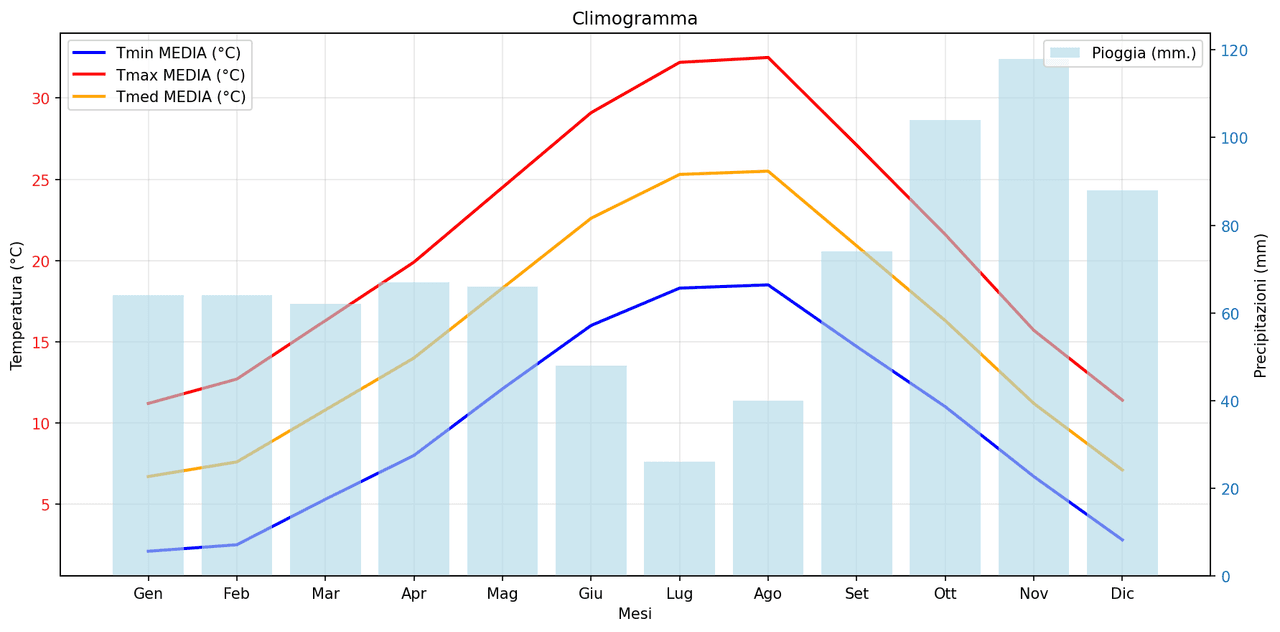
Climogramma di Firenze (Italia)
10
matplotlibhistogram
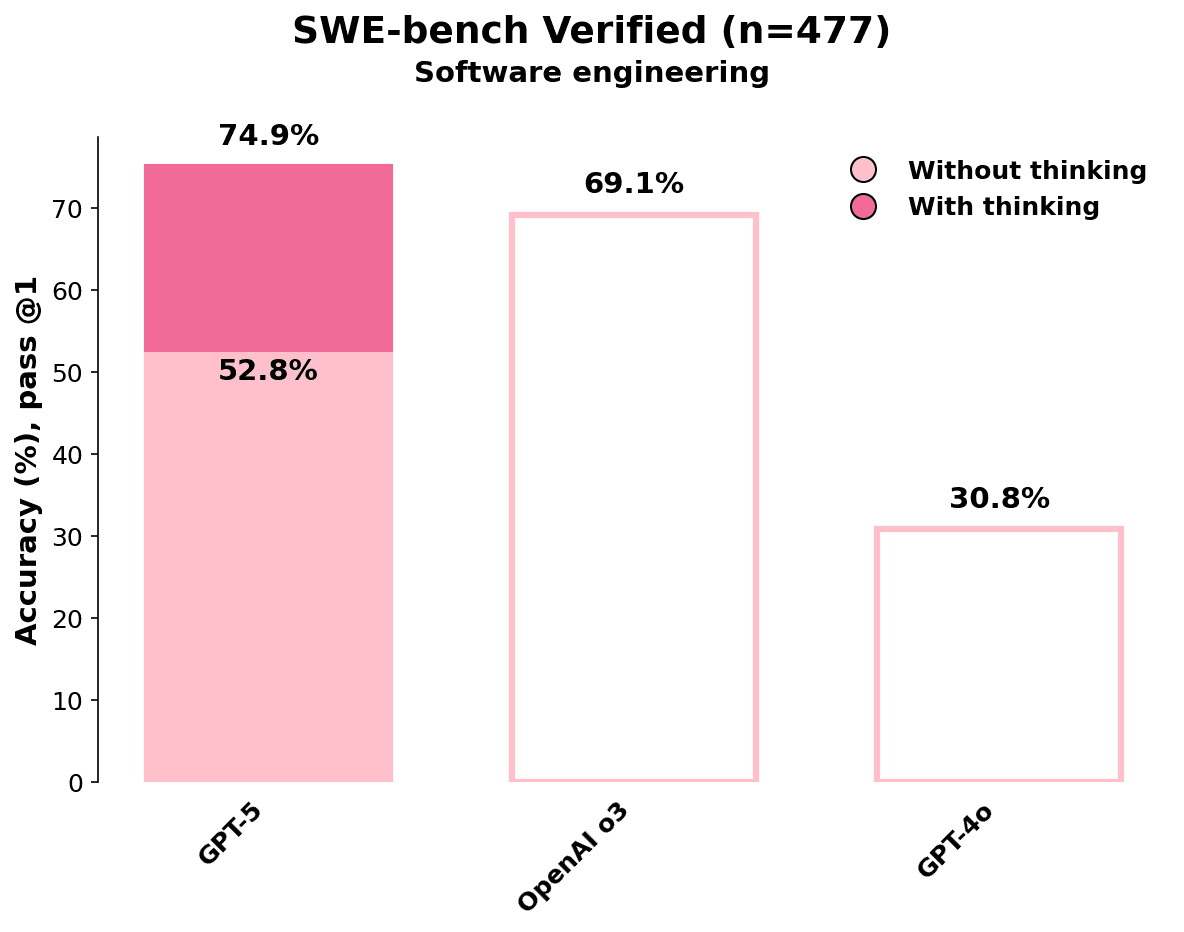
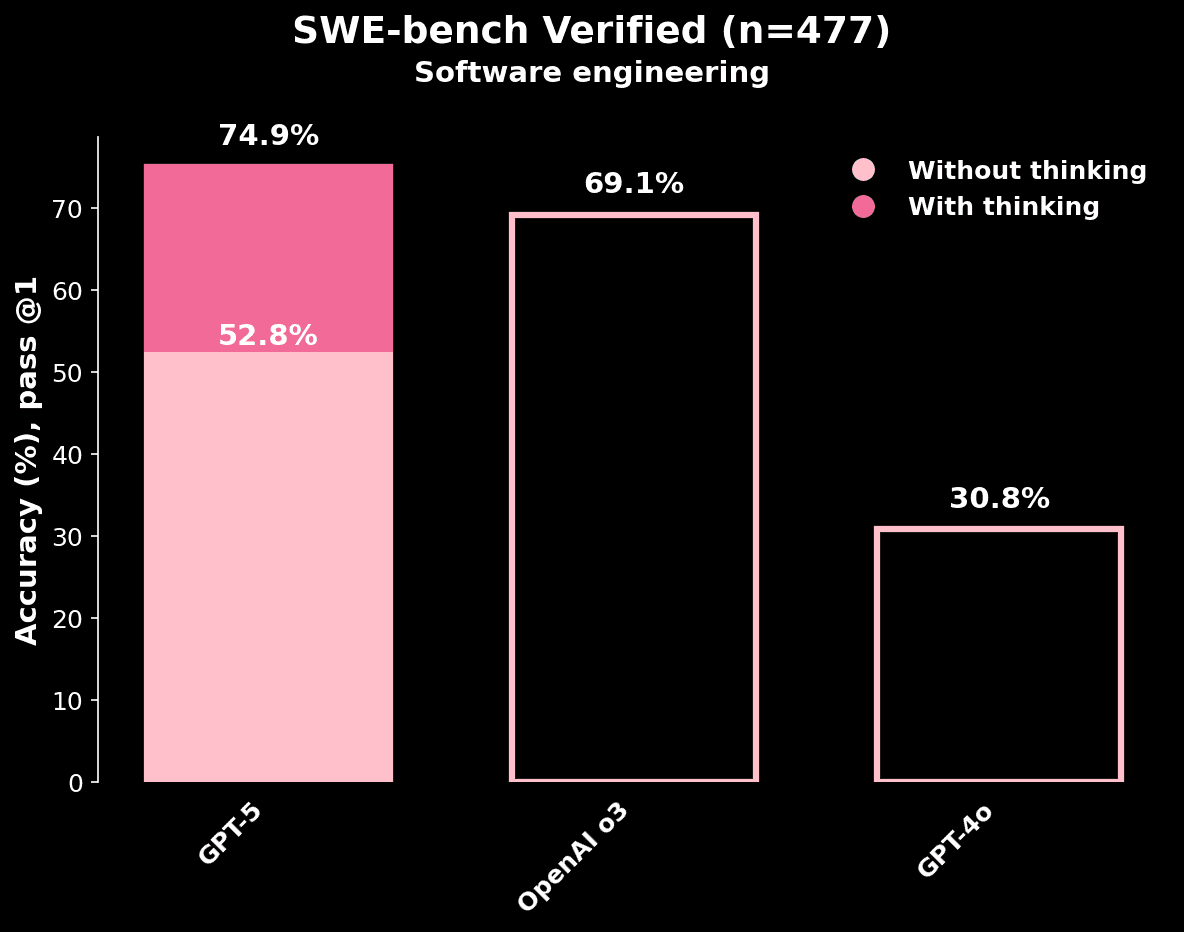
Accuracy (%) at pass @1 across different ChatGPT models.
10
matplotlibhistogram
Pass@1 accuracy (%) for GPT-5, OpenAI o3, and GPT-4o models
00