Menu
Refer a Friend
Share your link — earn +15 permanent plots for every friend who joins.
Sign in to get your referral linkGeopotential height at the 500 hPa pressure level
Description
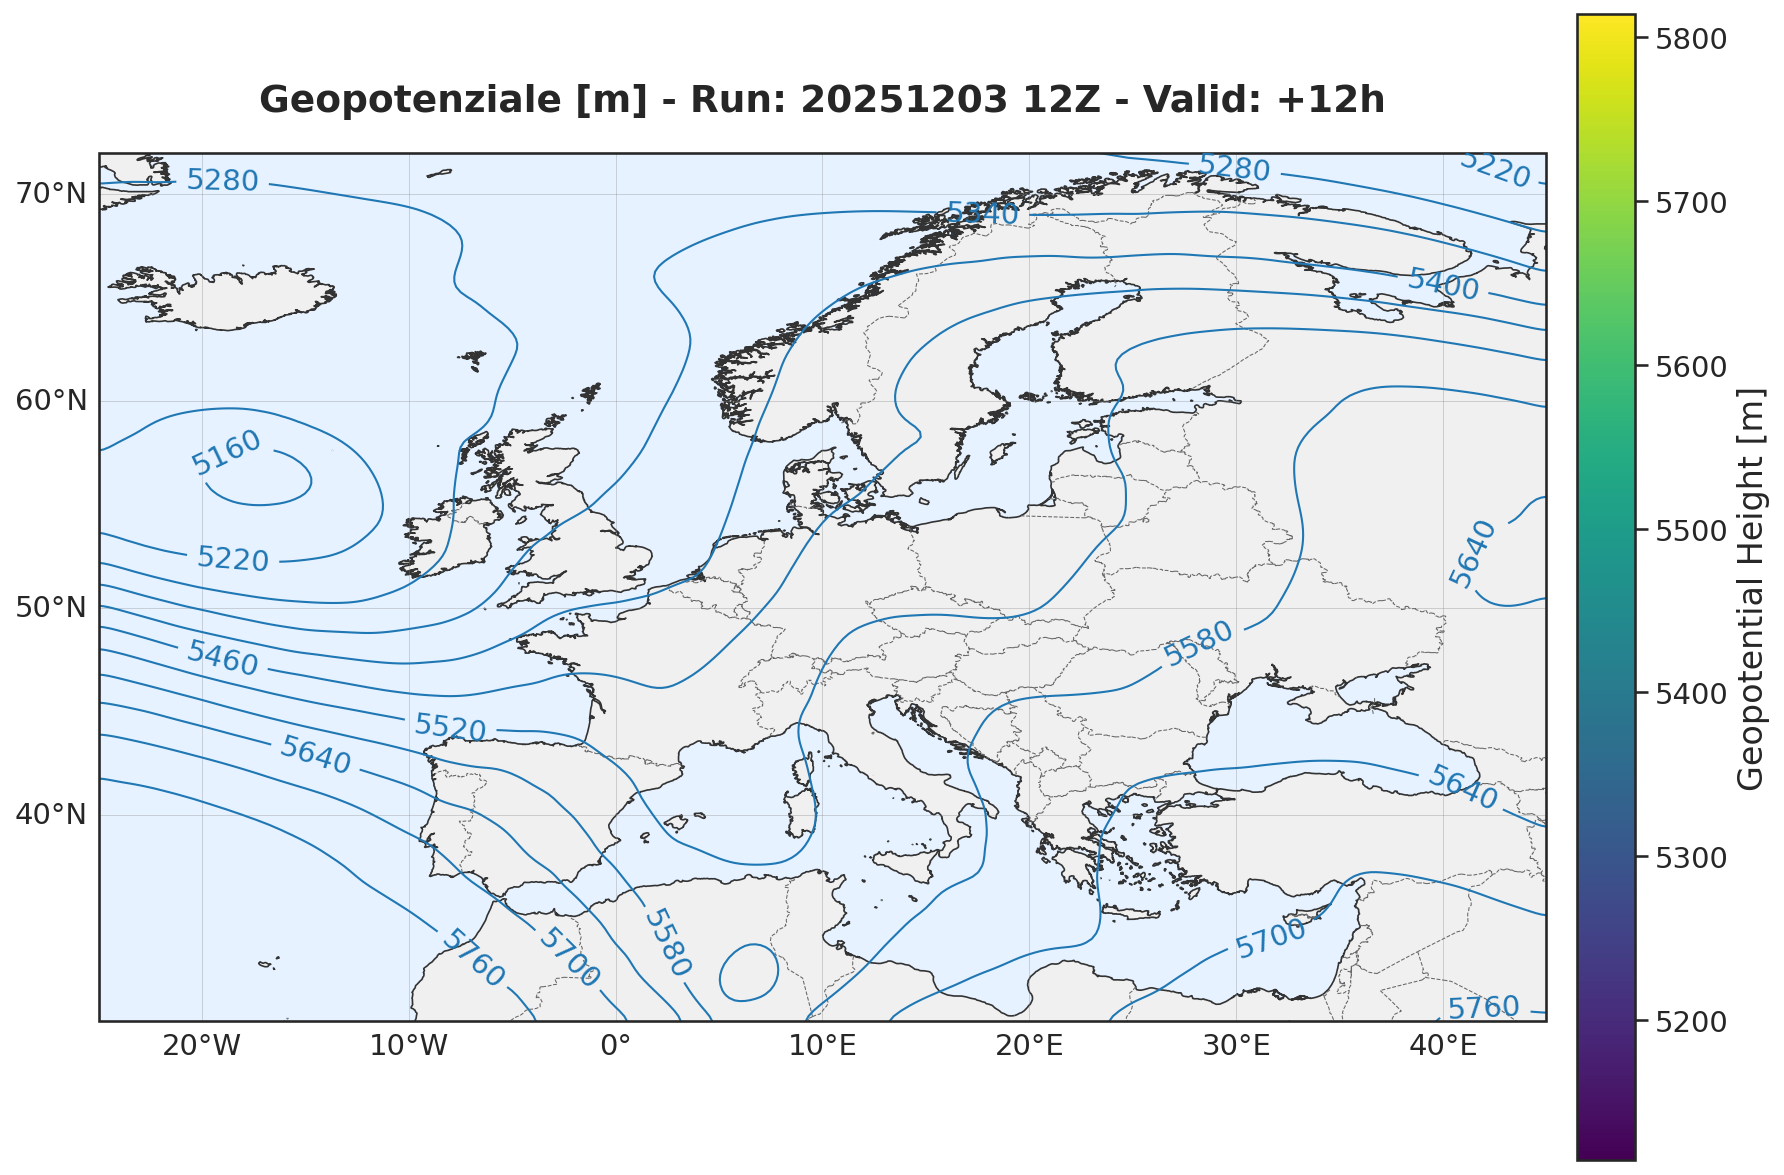
This visualization displays geopotential height at the 500 hPa pressure level over Europe and the North Atlantic region. The map shows atmospheric circulation patterns critical for weather forecasting, with contour lines representing equal geopotential heights at 60-meter intervals. The data represents a 12-hour forecast from the December 3, 2025 12Z model run. Higher geopotential heights typically indicate ridges (high pressure systems) while lower heights indicate troughs (low pressure systems). The visualization uses Gaussian smoothing (sigma=1.0) to reduce noise and highlight large-scale atmospheric patterns. The geographic extent (30-72°N, -25 to 45°E) covers most of Europe and the eastern North Atlantic, making it ideal for analyzing mid-latitude weather systems.
Tags
Creator
57343531-6c88-468e-a41a-a14a875e3f74
Published
December 3, 2025
More sharing options
More like this
Similar plots from the gallery.
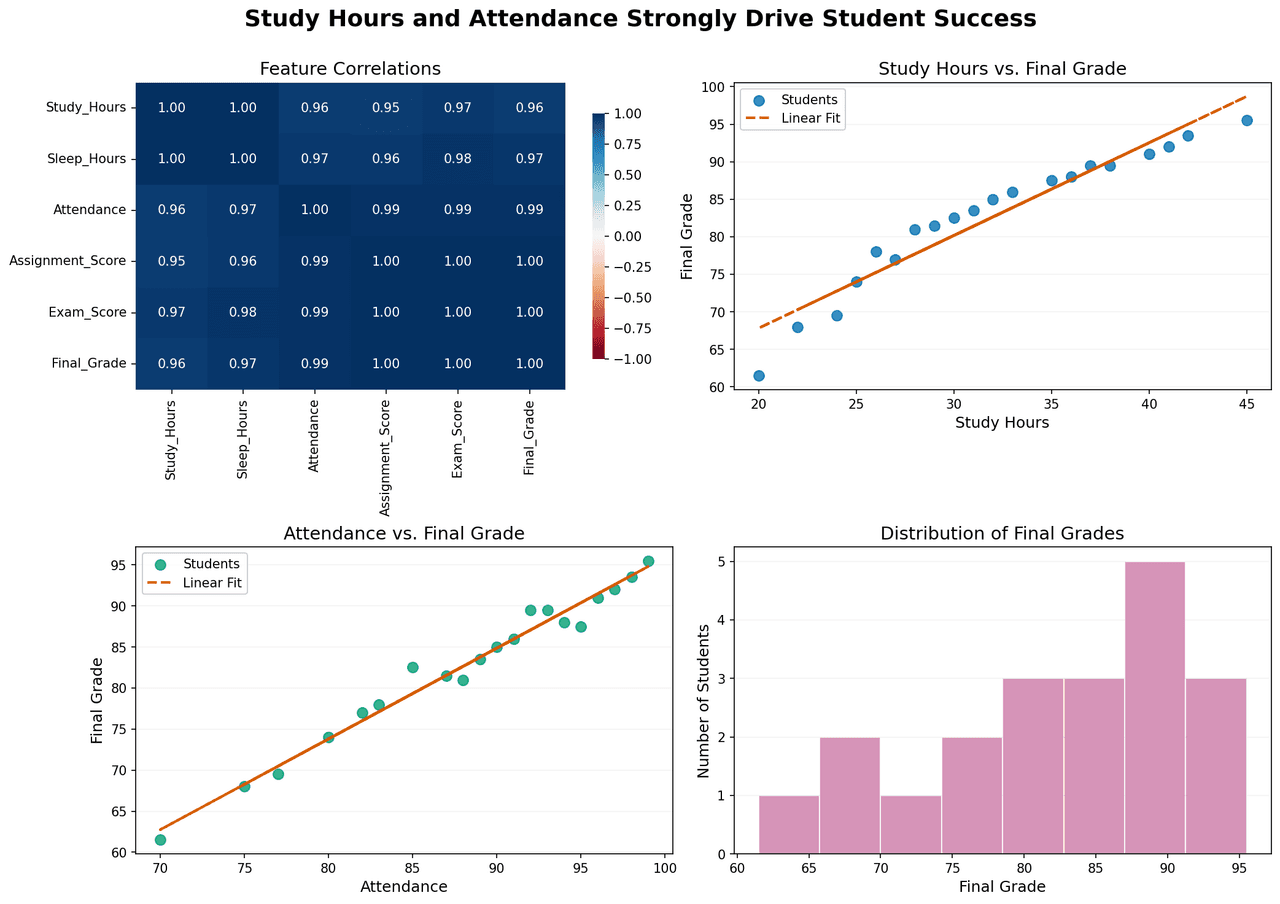
Correlation analysis and performance distribution of student success metrics.
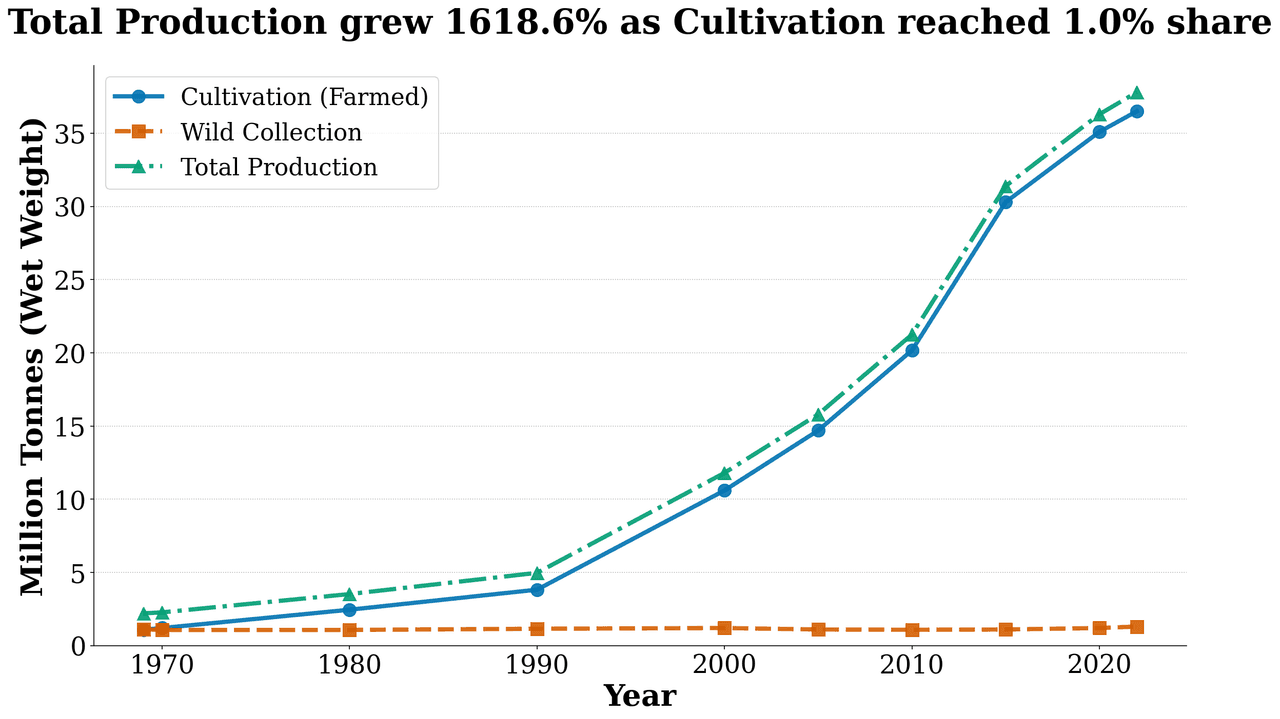
Production Trend
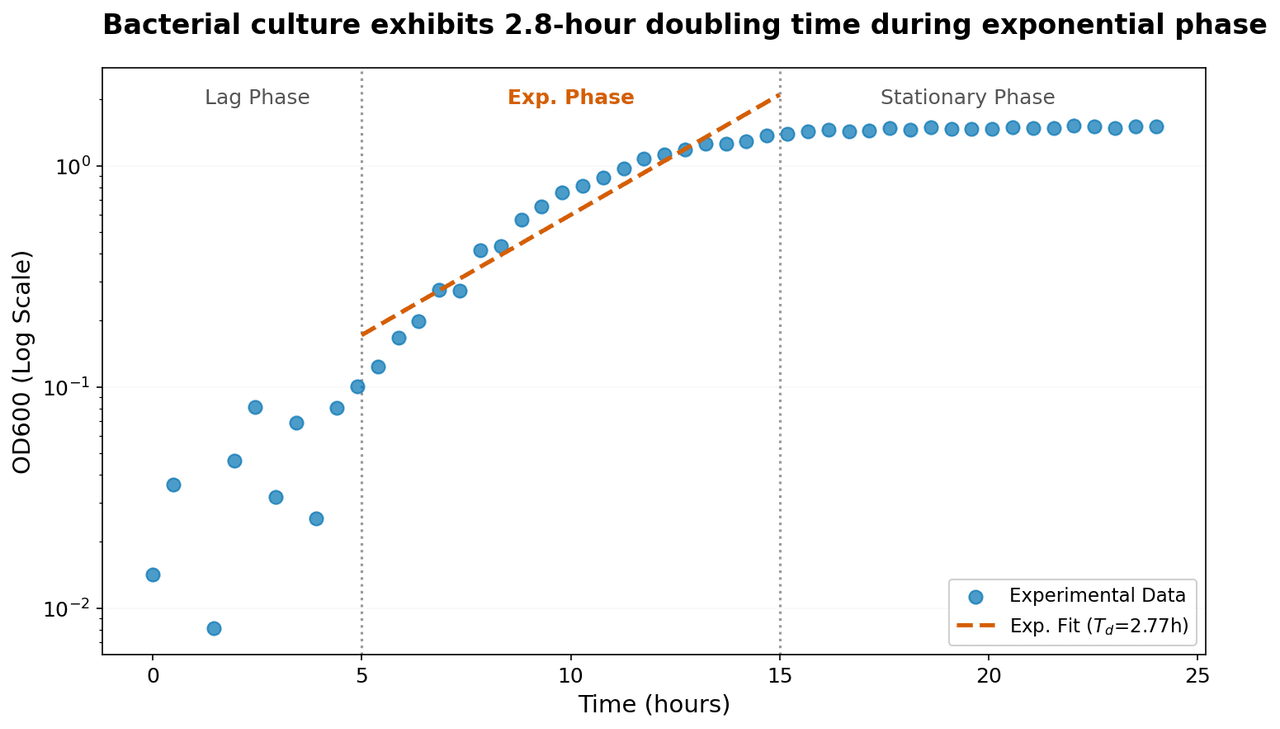
Semi-logarithmic plot of bacterial growth showing optical density (OD600) as a function of time.
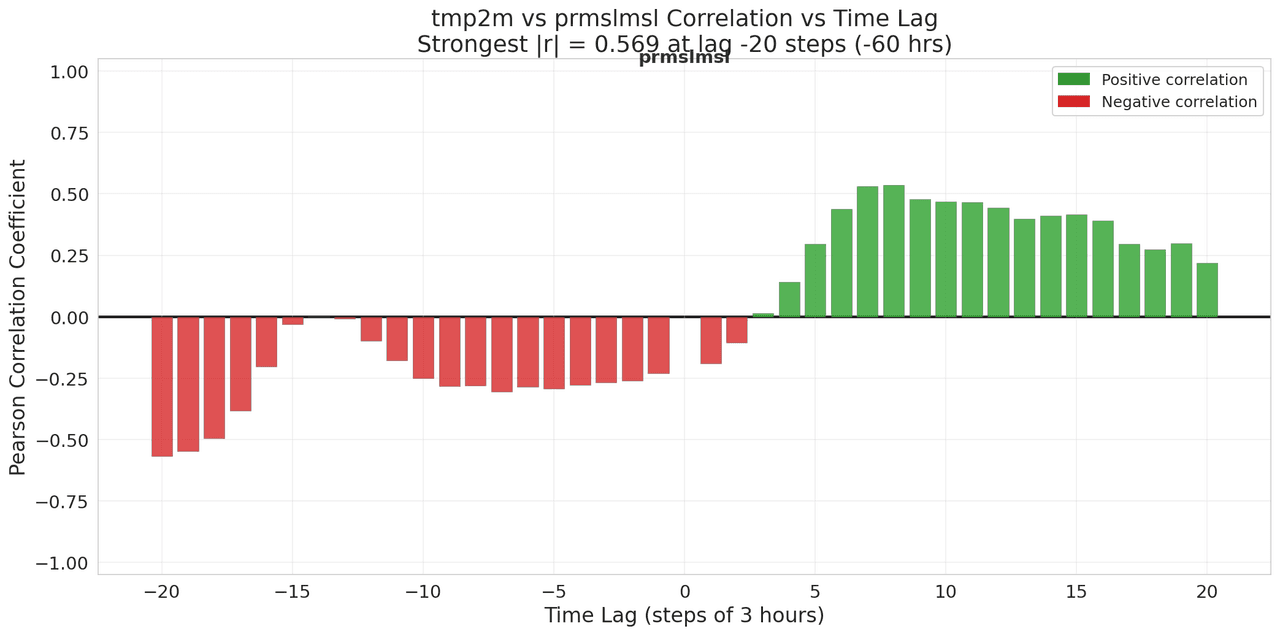
Lagged Correlation Analysis
![PWAT (pwatclm) and Td (dpt2m) time series data (10 three-hourly observations) normalized via min-max scaling to [0,1] independently.](/_next/image?url=https%3A%2F%2Fmznathvfriiouibqrfyh.supabase.co%2Fstorage%2Fv1%2Fobject%2Fpublic%2Fgallery-images%2Fvik.ariel-bc5231dabc%2F20251208182006-3b8626a3dd88.png&w=1280&q=70)
PWAT (pwatclm) and Td (dpt2m) time series data (10 three-hourly observations) normalized via min-max scaling to [0,1] independently.