Menu
Refer a Friend
Share your link — earn +15 permanent plots for every friend who joins.
Sign in to get your referral linkmatplotlibscatter
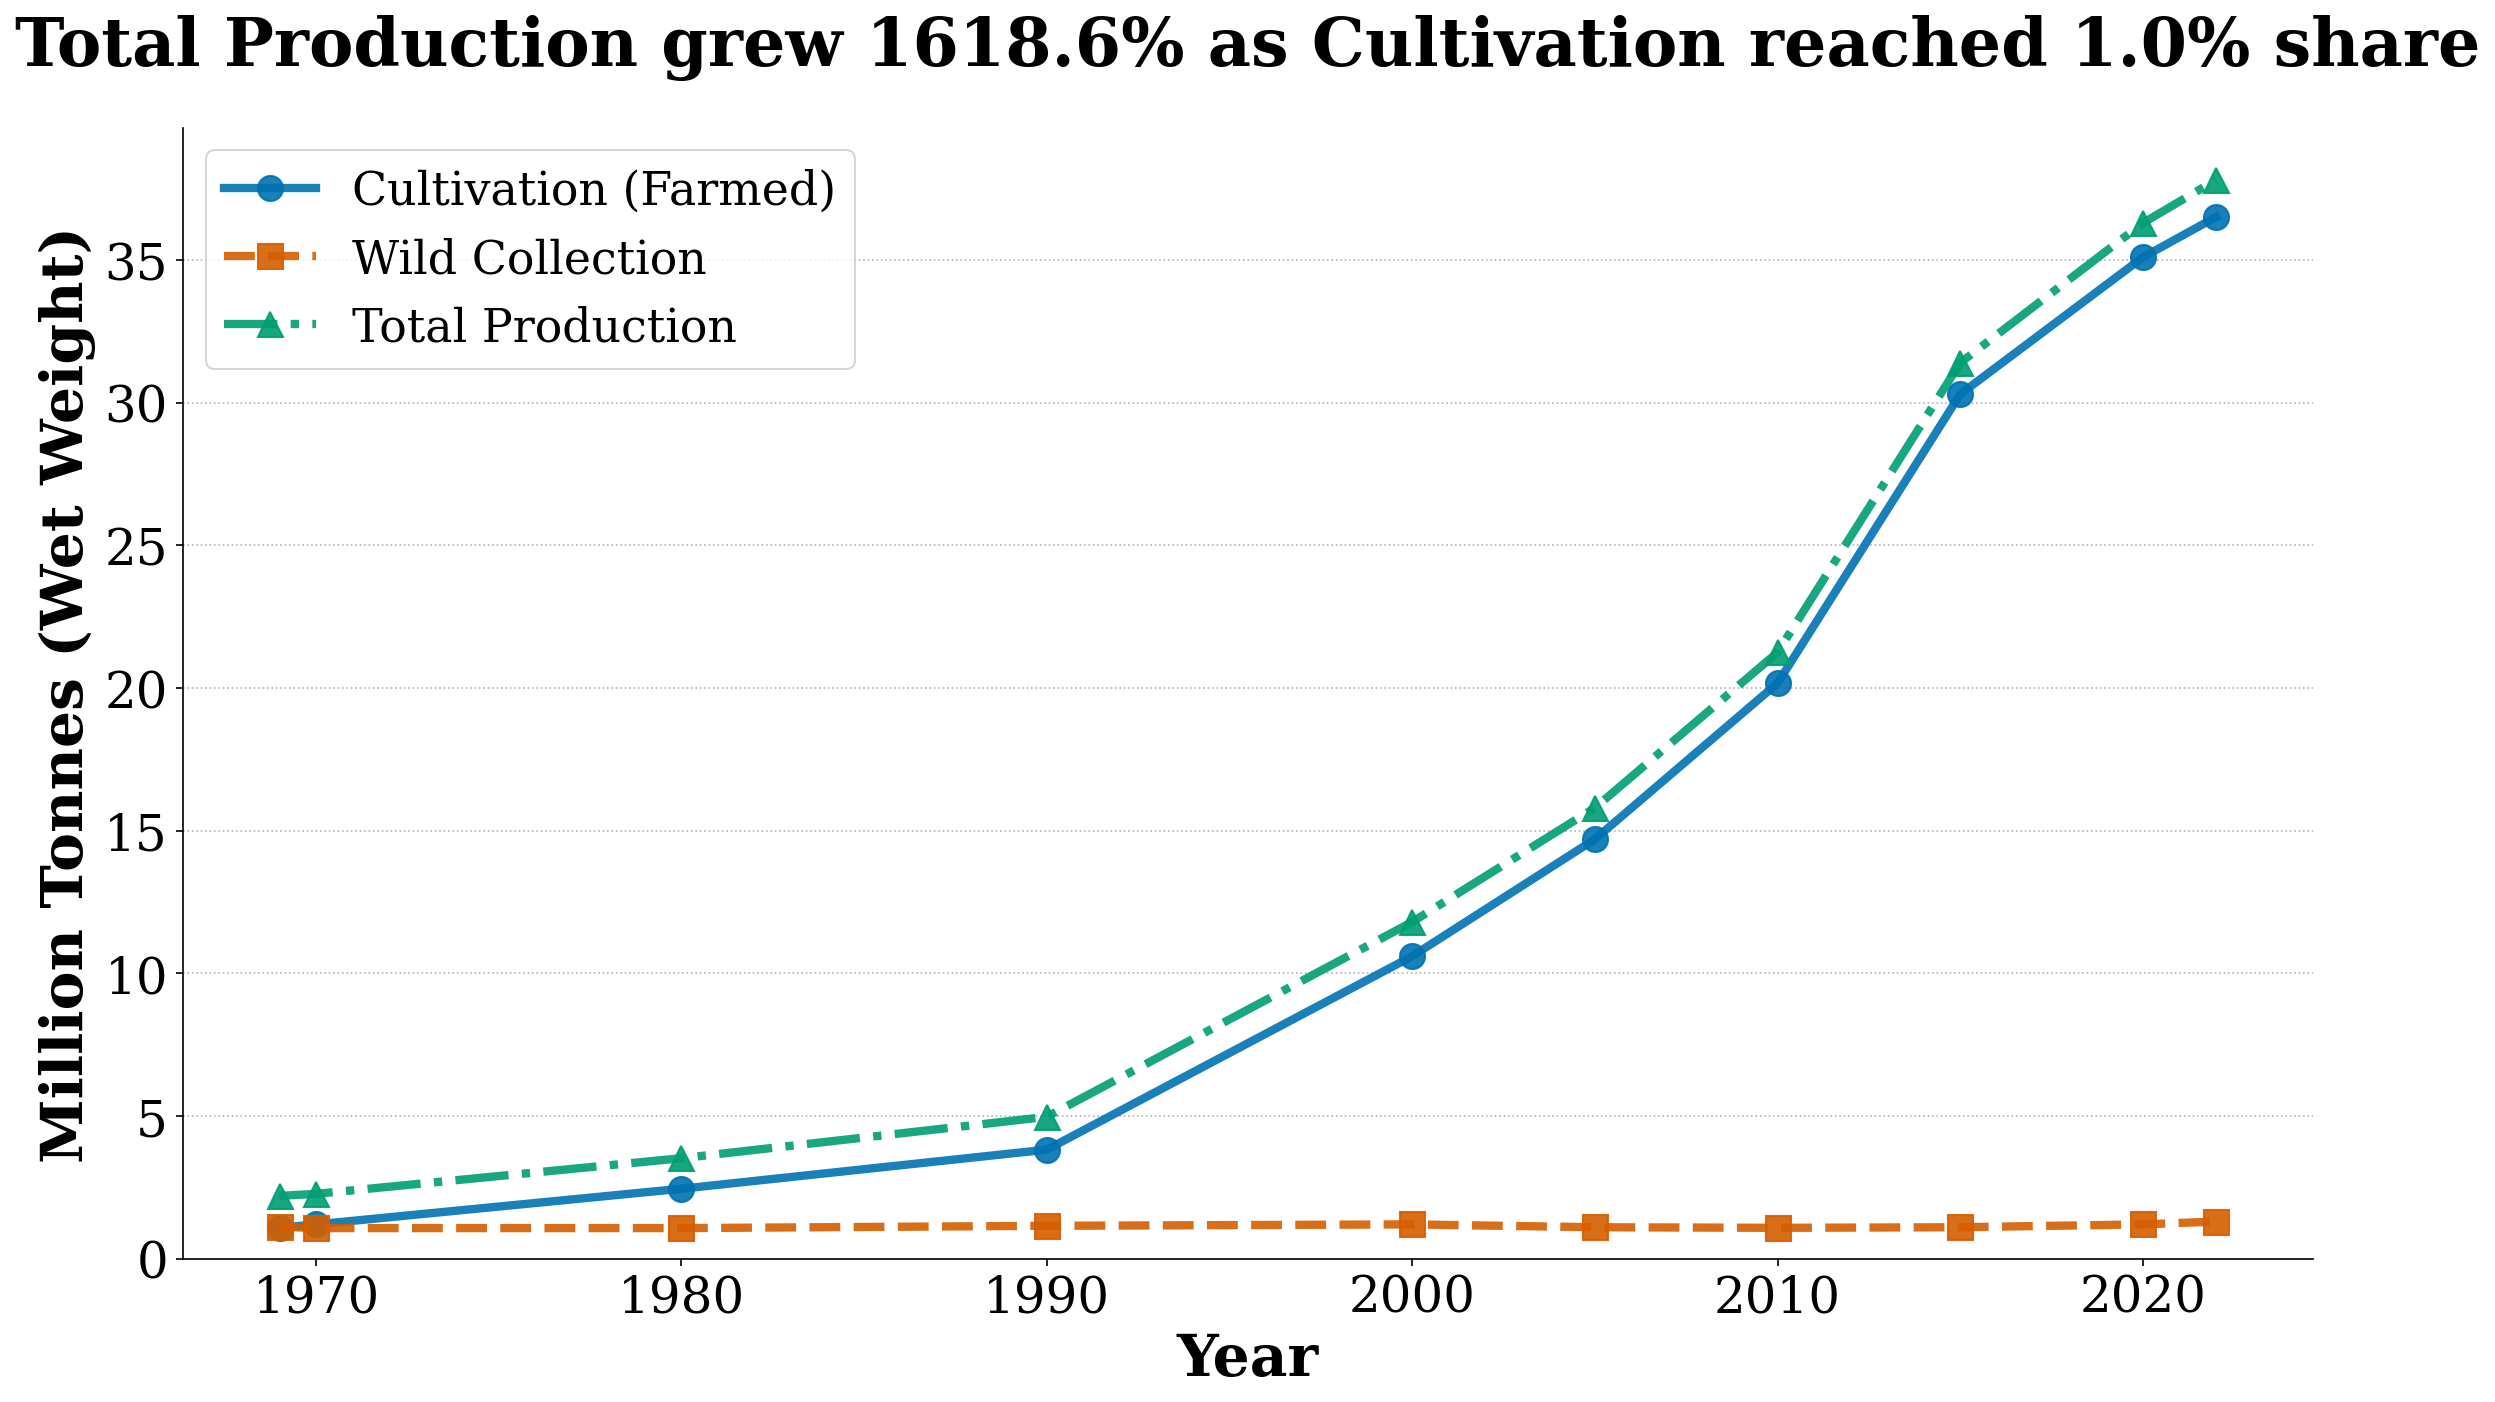
Production Trend
Description
This plot does not include a description yet.
Tags
#code#data available#scatter
0
Creator
5b44f437-6e3b-4dc5-b6cc-c040493215f3
Published
February 28, 2026
More sharing options
More like this
Similar plots from the gallery.
matplotlibscatter
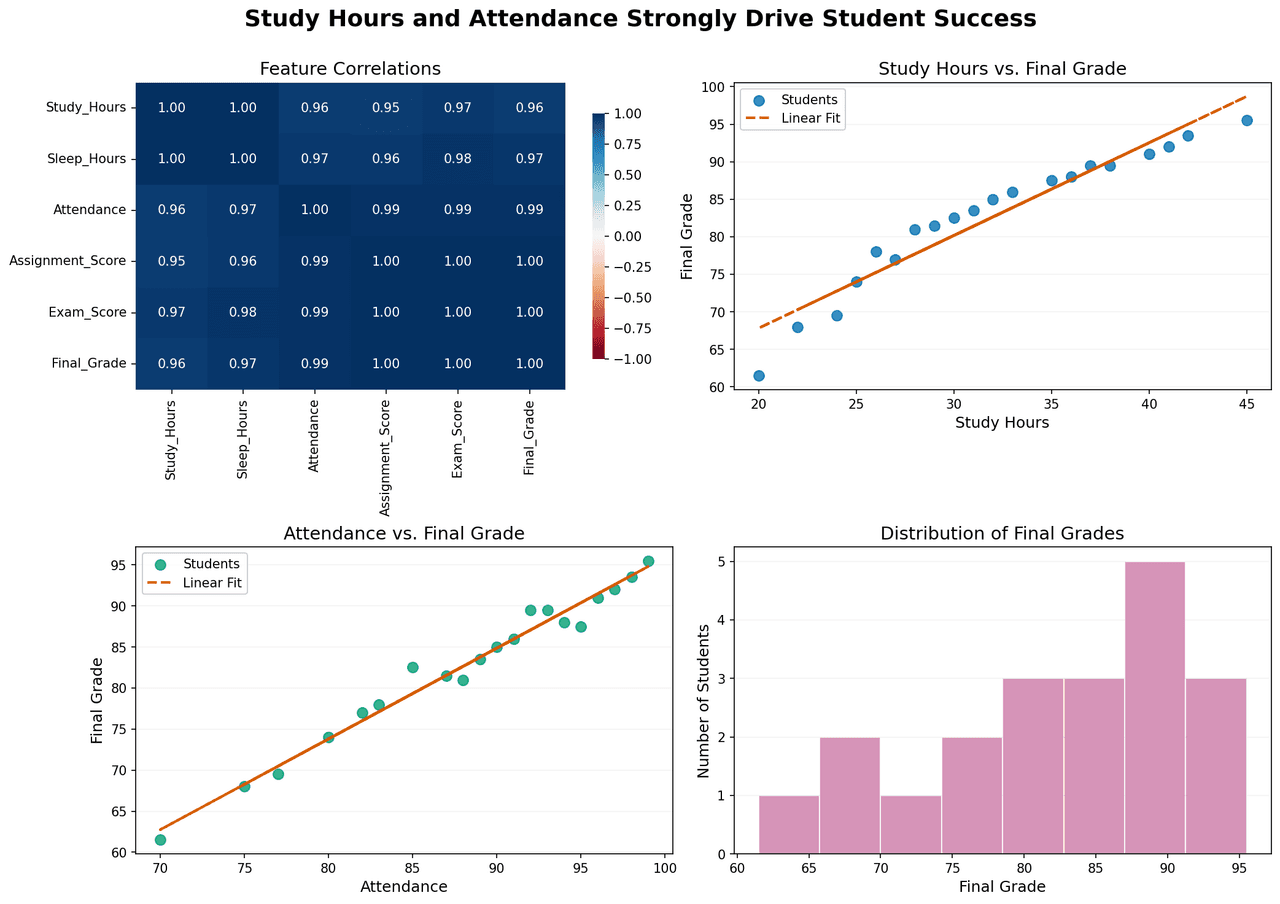
Correlation analysis and performance distribution of student success metrics.
00
matplotlibscatter
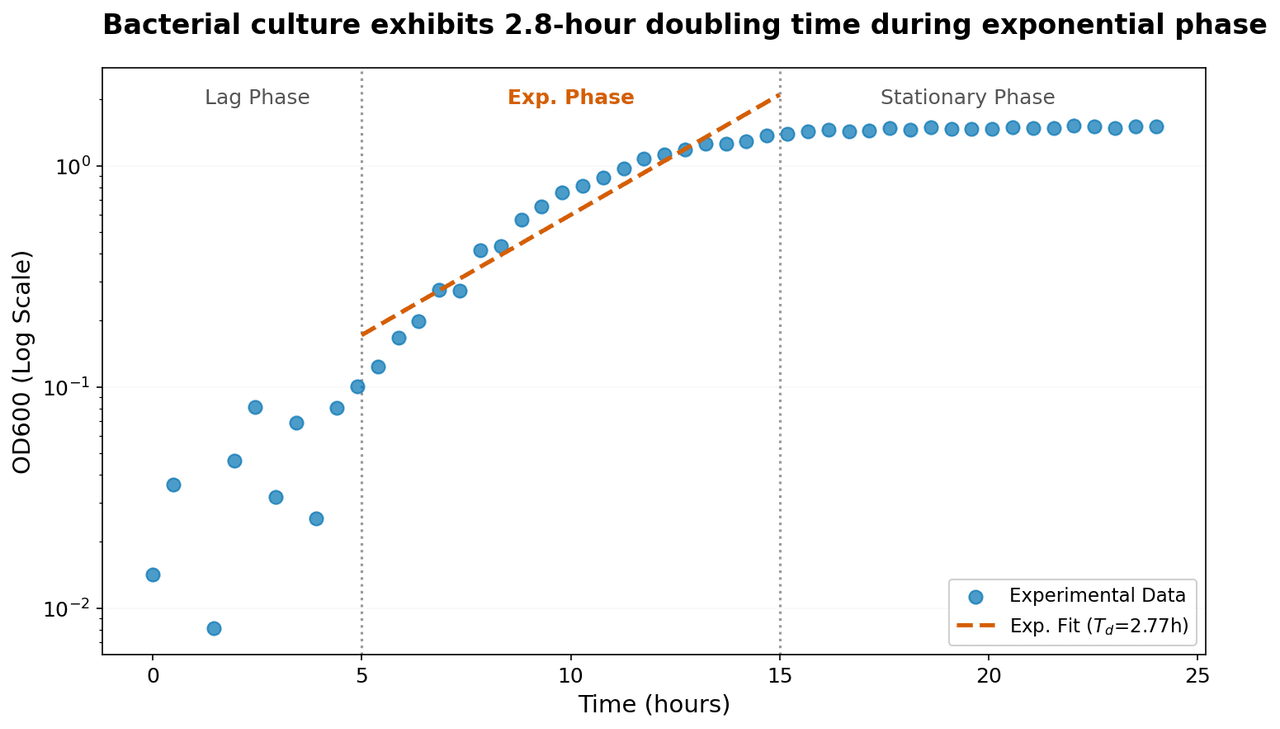
Semi-logarithmic plot of bacterial growth showing optical density (OD600) as a function of time.
00
matplotlibscatter
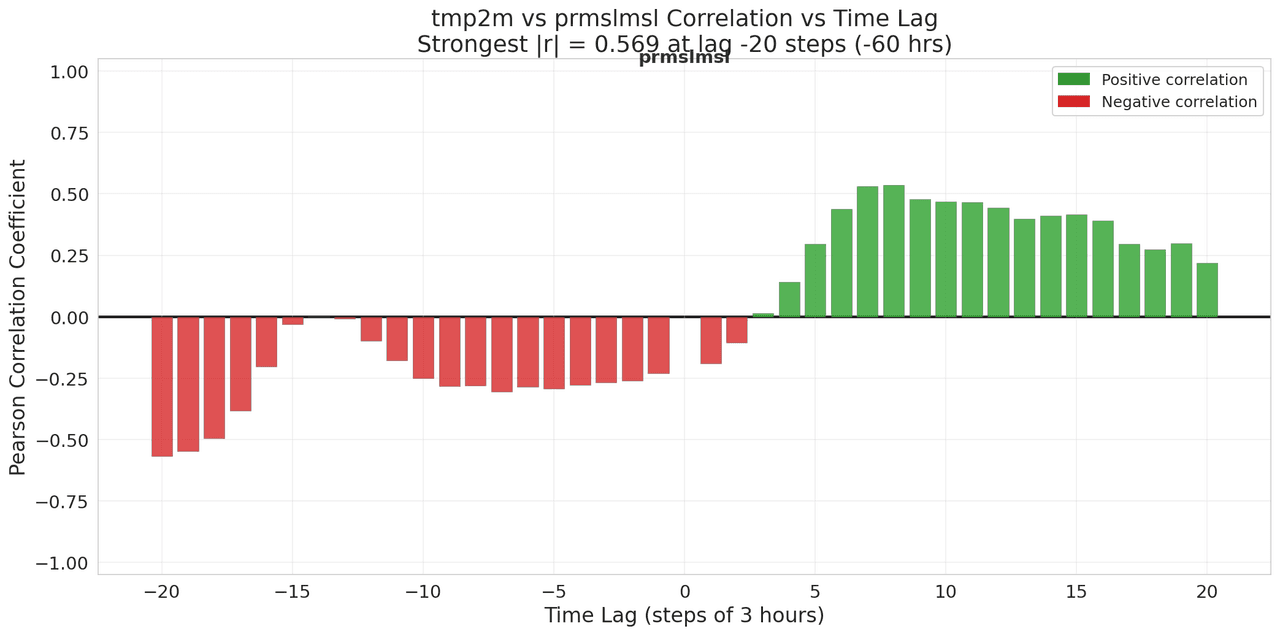
Lagged Correlation Analysis
01
![PWAT (pwatclm) and Td (dpt2m) time series data (10 three-hourly observations) normalized via min-max scaling to [0,1] independently.](/_next/image?url=https%3A%2F%2Fmznathvfriiouibqrfyh.supabase.co%2Fstorage%2Fv1%2Fobject%2Fpublic%2Fgallery-images%2Fvik.ariel-bc5231dabc%2F20251208182006-3b8626a3dd88.png&w=1280&q=70)
matplotlibscatter
PWAT (pwatclm) and Td (dpt2m) time series data (10 three-hourly observations) normalized via min-max scaling to [0,1] independently.
00
matplotlibscatter
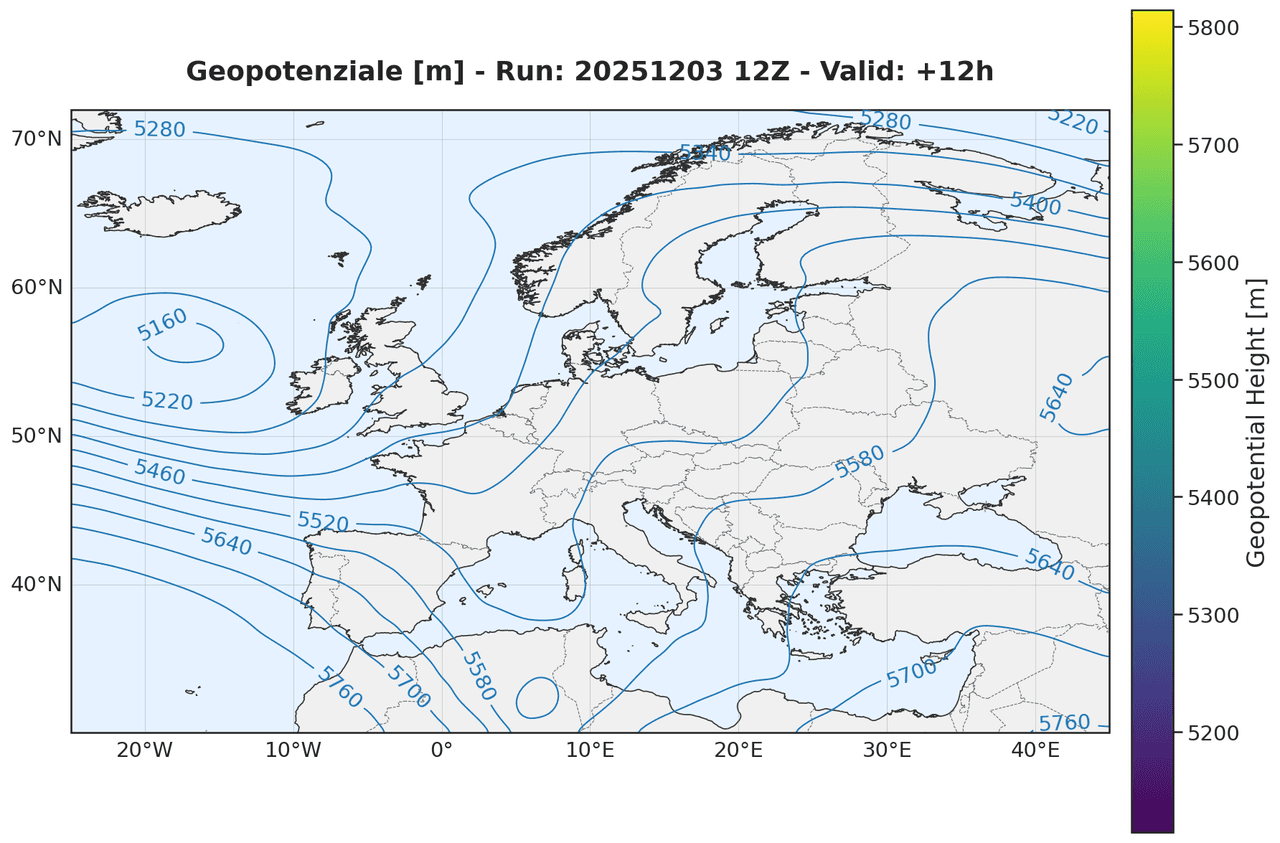
Geopotential height at the 500 hPa pressure level
00
matplotlibscatter
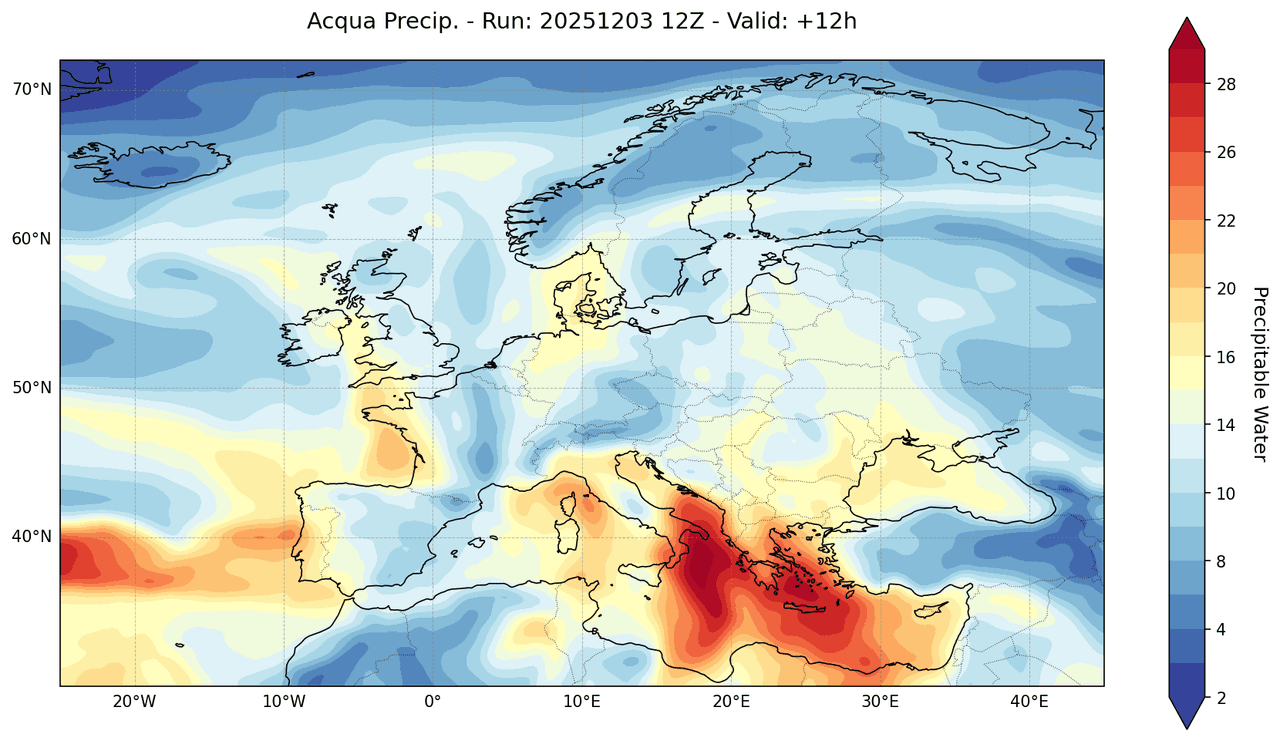
Map of precipitable water
01