Menu
Refer a Friend
Share your link — earn +15 permanent plots for every friend who joins.
Sign in to get your referral linkMap of precipitable water
Description
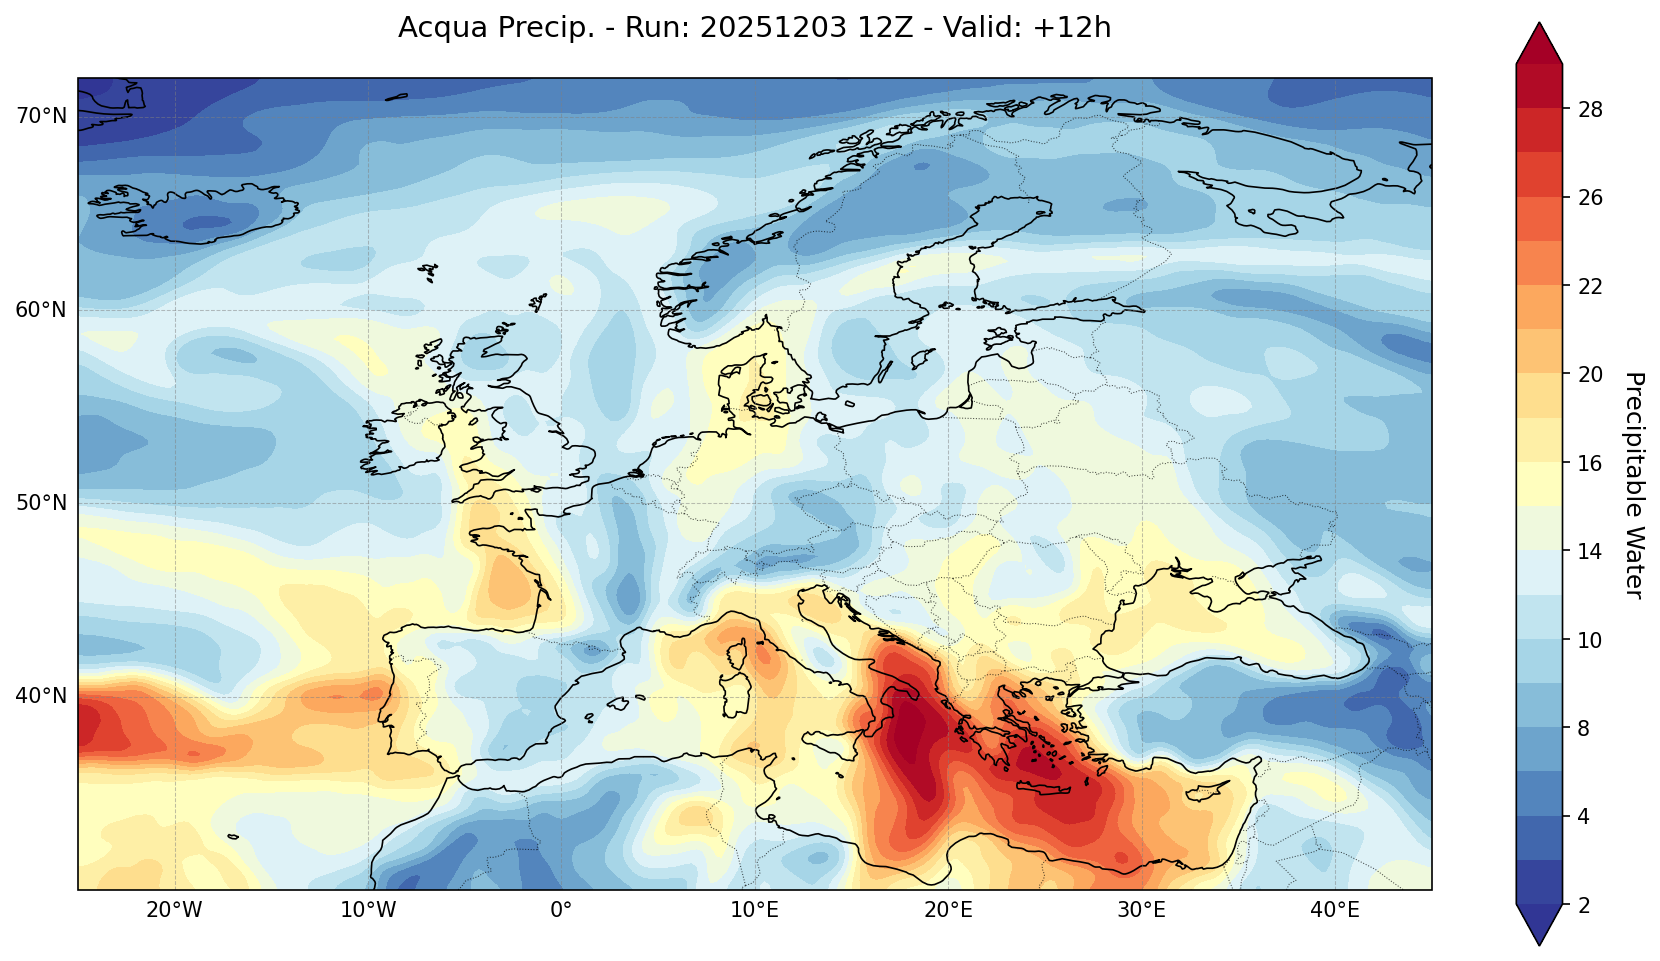
The visualization presents a spatial map of precipitable water (PWAT) derived from climate model output, smoothed using a Gaussian filter for enhanced interpretability. The plot covers a geographic extent from 30°N to 72°N latitude and -25°E to 45°E longitude, encompassing parts of North Africa, Europe, and the Middle East. PWAT values, representing the total atmospheric water vapor column in millimeters, are contoured with a reversed RdYlBu colormap, where warmer colors indicate higher moisture content. Based on the sample data at 30°N, PWAT ranges from approximately 17.6 to 19.3 mm, suggesting moderate moisture levels typical for mid-latitudes in a specific forecast valid time (+12h from run 20251203 12Z). This distribution highlights regional moisture gradients, potentially linked to synoptic weather patterns such as fronts or cyclones, which are crucial for precipitation forecasting and climate analysis. The smoothing (sigma=1.0) reduces noise in the gridded data, revealing broader spatial trends rather than local variability.
Tags
Creator
57343531-6c88-468e-a41a-a14a875e3f74
Published
December 3, 2025
More sharing options
More like this
Similar plots from the gallery.
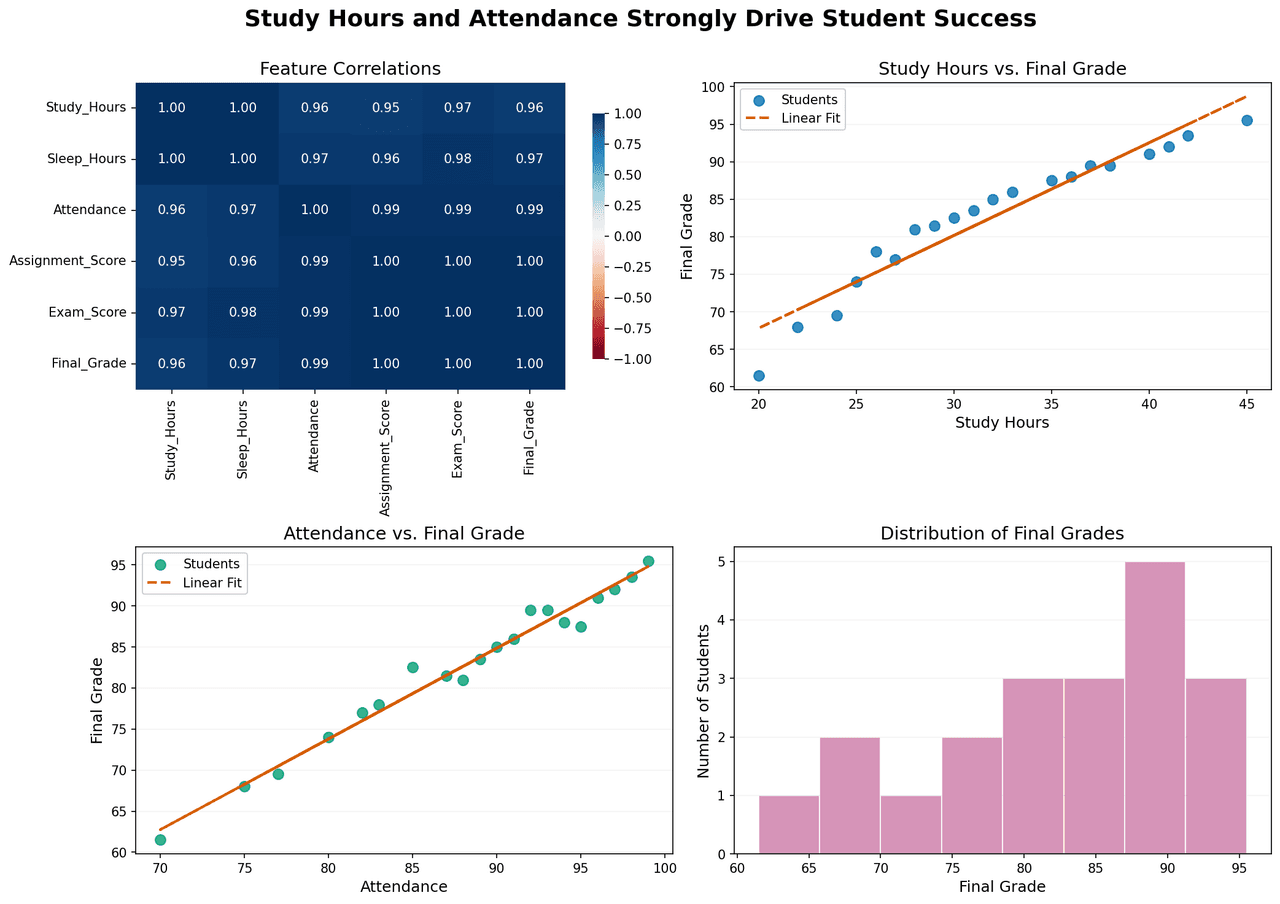
Correlation analysis and performance distribution of student success metrics.
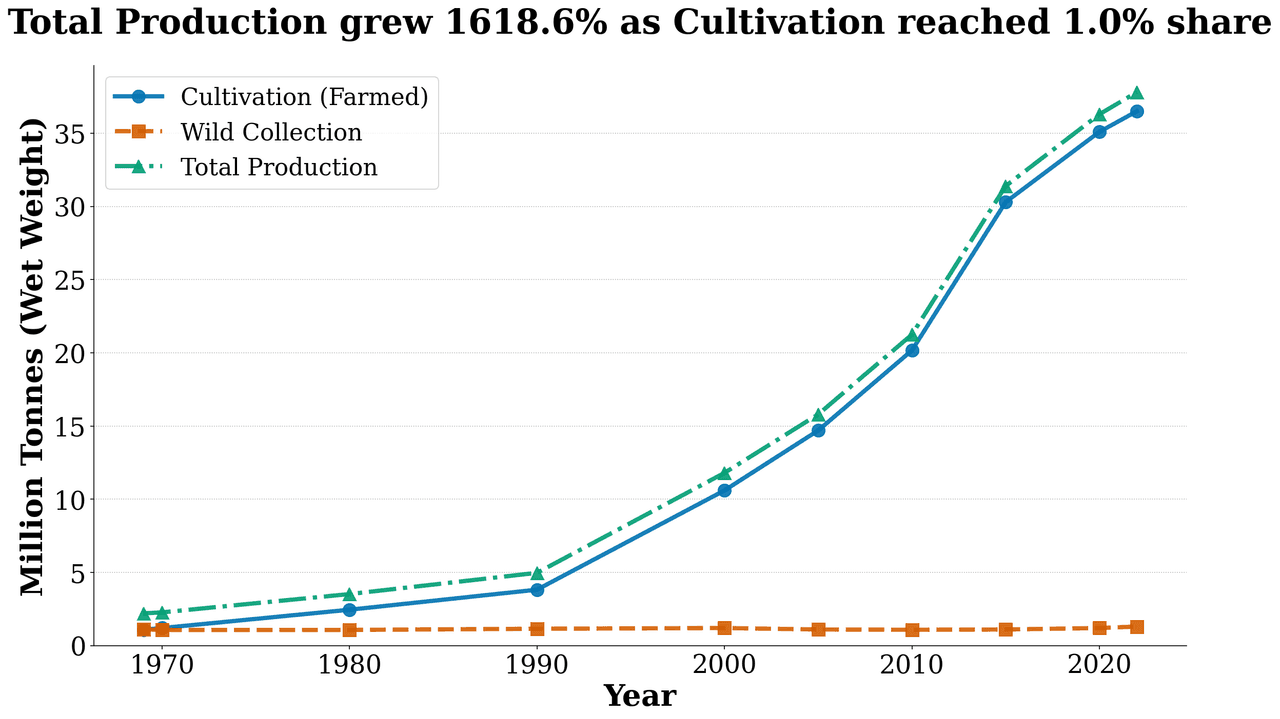
Production Trend
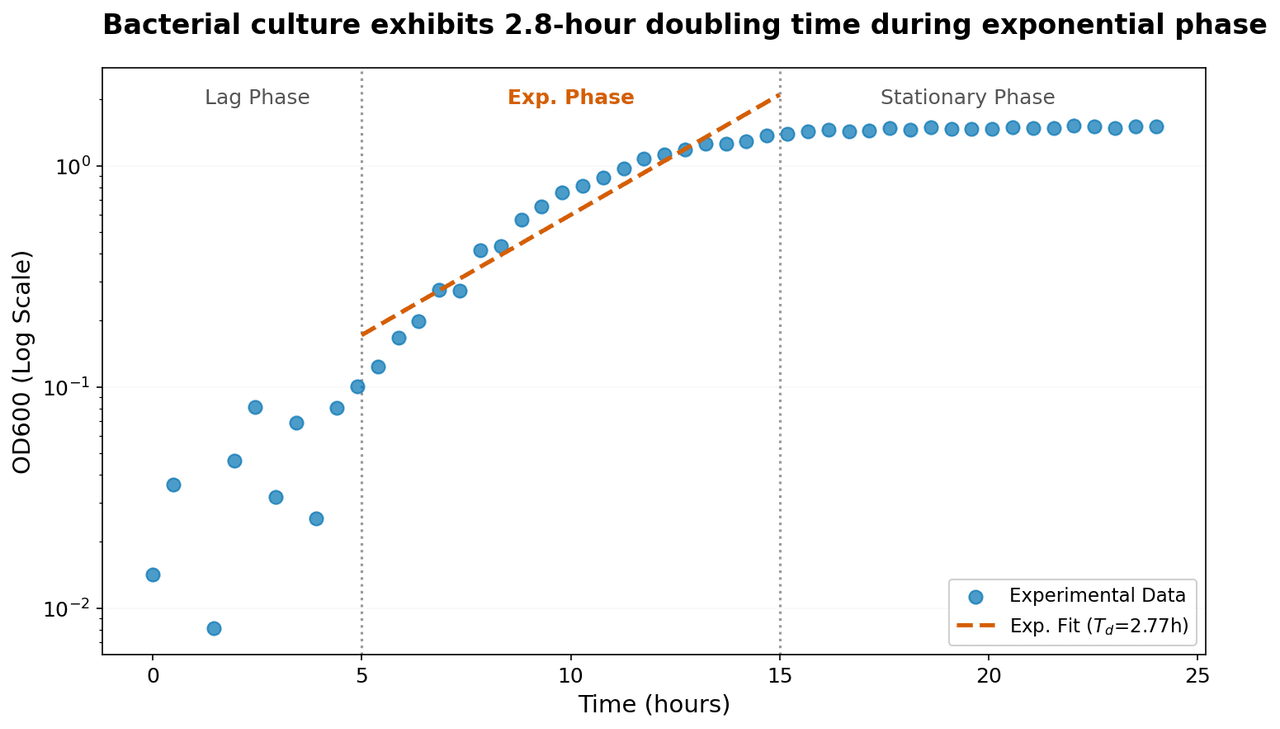
Semi-logarithmic plot of bacterial growth showing optical density (OD600) as a function of time.
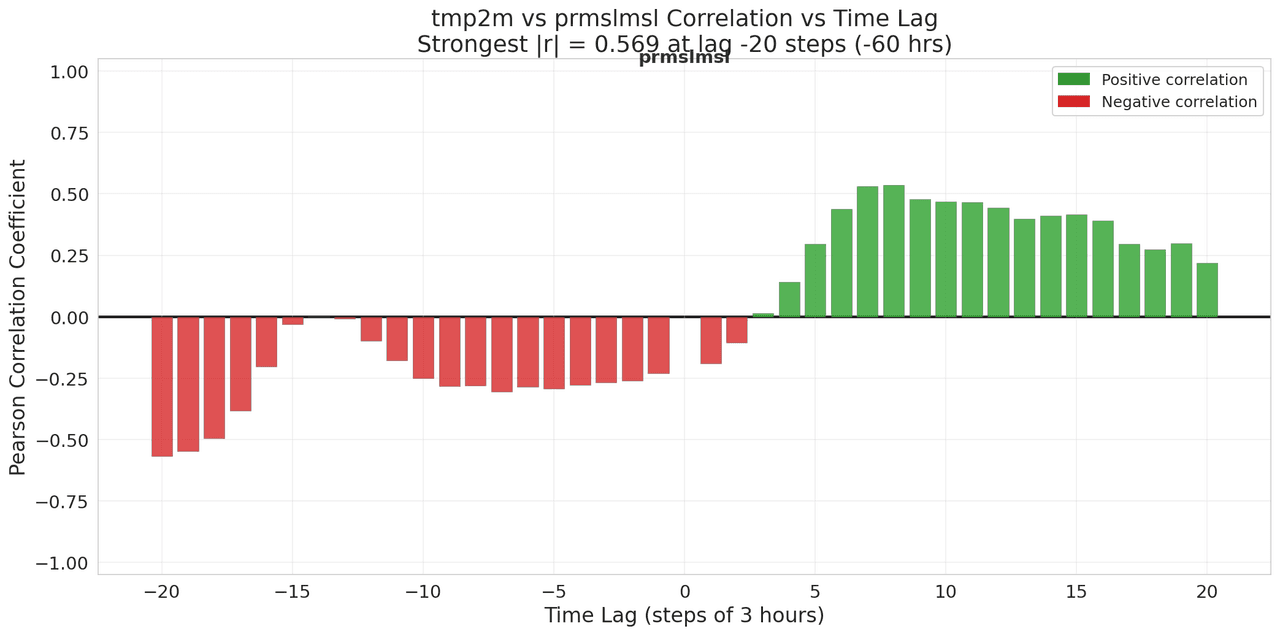
Lagged Correlation Analysis
![PWAT (pwatclm) and Td (dpt2m) time series data (10 three-hourly observations) normalized via min-max scaling to [0,1] independently.](/_next/image?url=https%3A%2F%2Fmznathvfriiouibqrfyh.supabase.co%2Fstorage%2Fv1%2Fobject%2Fpublic%2Fgallery-images%2Fvik.ariel-bc5231dabc%2F20251208182006-3b8626a3dd88.png&w=1280&q=70)
PWAT (pwatclm) and Td (dpt2m) time series data (10 three-hourly observations) normalized via min-max scaling to [0,1] independently.