Menu
Refer a Friend
Share your link — earn +15 permanent plots for every friend who joins.
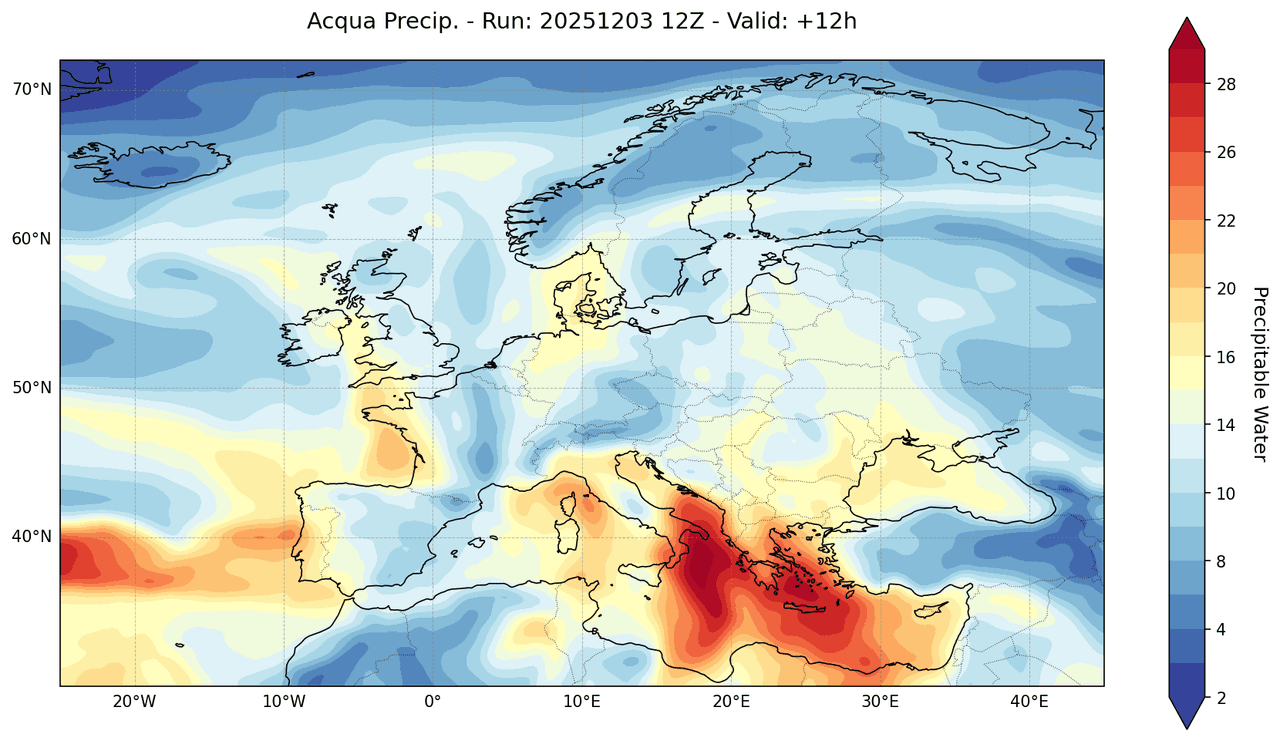
Sign in to get your referral linkPWAT (pwatclm) and Td (dpt2m) time series data (10 three-hourly observations) normalized via min-max scaling to [0,1] independently.
![PWAT (pwatclm) and Td (dpt2m) time series data (10 three-hourly observations) normalized via min-max scaling to [0,1] independently.](https://mznathvfriiouibqrfyh.supabase.co/storage/v1/object/public/gallery-images/vik.ariel-bc5231dabc/20251208182006-3b8626a3dd88.png)
Description
This visualization presents a time series comparison of normalized precipitable water (PWAT, blue line) and 2-m dew point temperature (Td, orange line) from 2025-12-07 00:00 to 2025-12-08 03:00 (27 hours), with both variables independently min-max scaled to [0,1]. Conditional shading highlights periods where normalized Td exceeds PWAT (red fill, 70% of observations) versus PWAT exceeds Td (blue fill, 30%). A strong positive correlation (r = 0.92) indicates that PWAT and Td co-vary closely, reflecting coupled atmospheric moisture dynamics. Td dominance suggests relatively higher dew point anomalies during much of the period, potentially signaling elevated near-surface humidity or saturation conditions despite PWAT fluctuations. Both series exhibit an initial rise peaking mid-period, with PWAT briefly surpassing Td around 15:00-21:00 on Dec 7, followed by Td resurgence. This pattern underscores moisture buildup and possible dew formation potential, valuable for meteorological analysis or forecasting.
Tags
Creator
57343531-6c88-468e-a41a-a14a875e3f74
Published
December 8, 2025
More sharing options
More like this
Similar plots from the gallery.
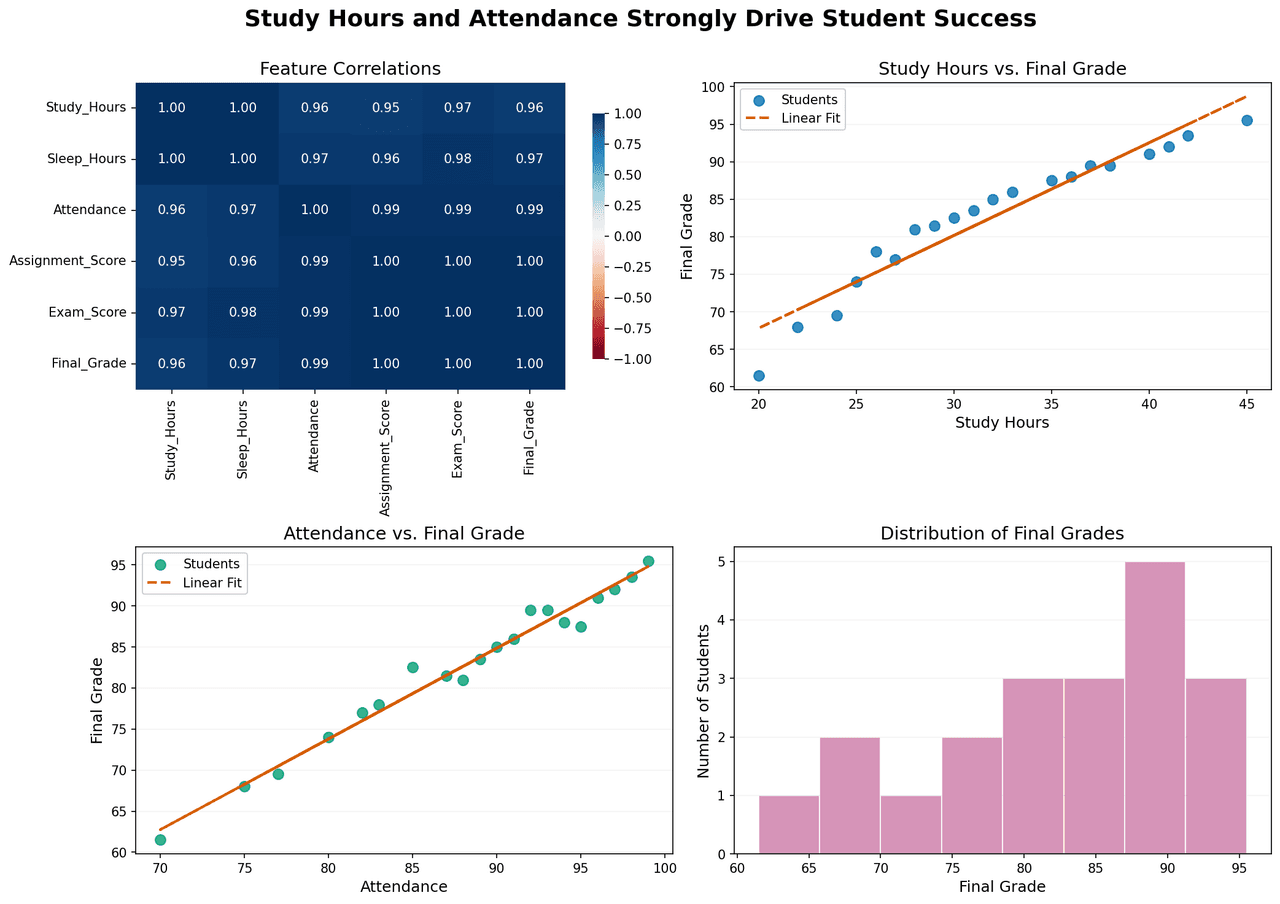
Correlation analysis and performance distribution of student success metrics.
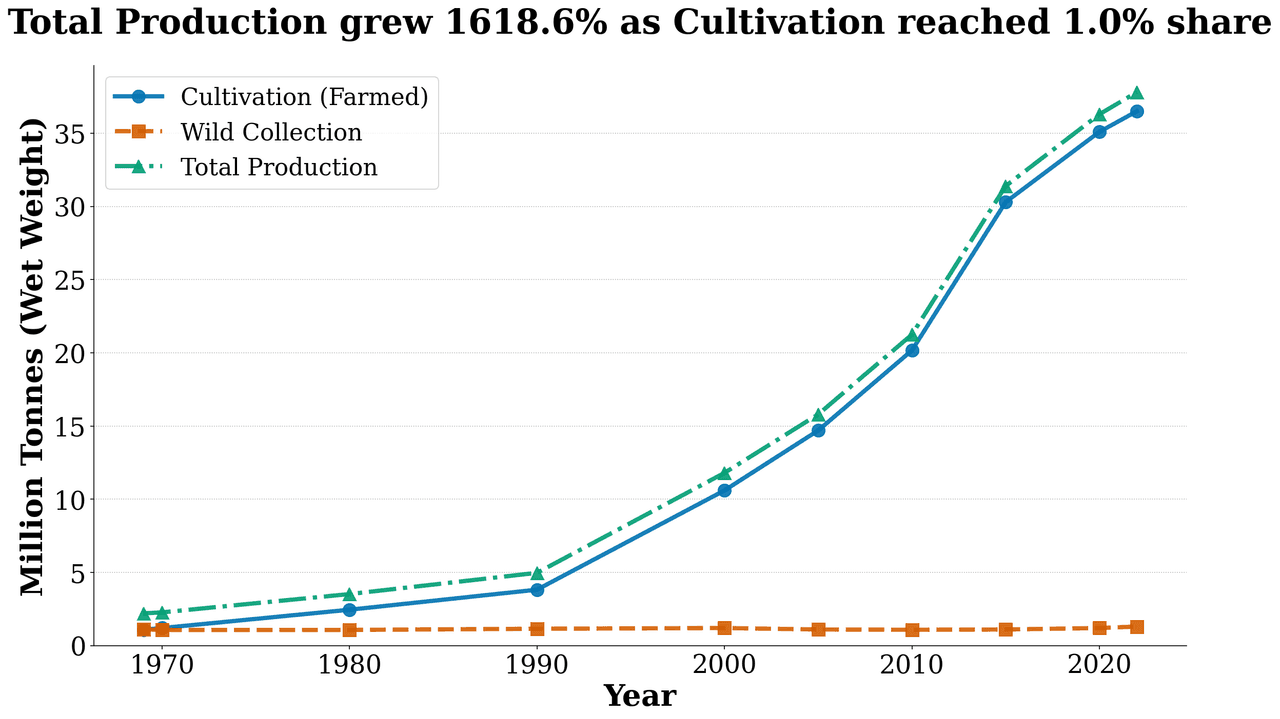
Production Trend
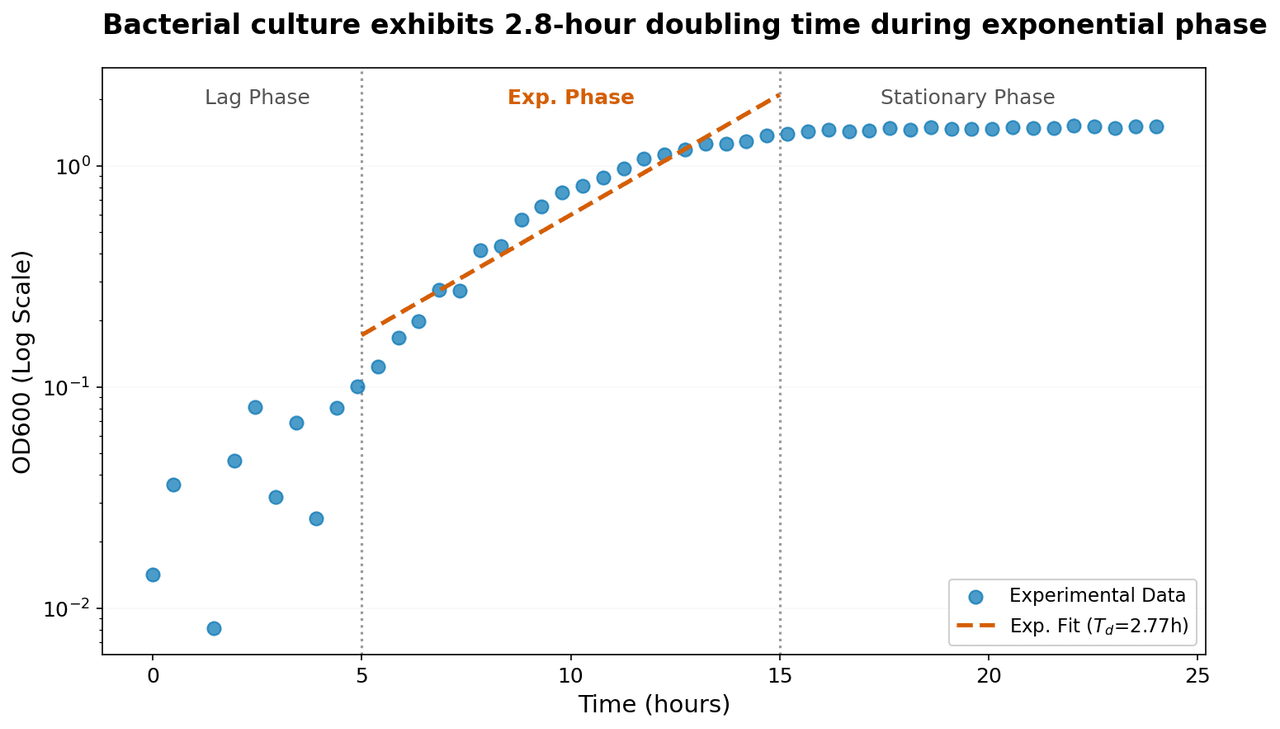
Semi-logarithmic plot of bacterial growth showing optical density (OD600) as a function of time.
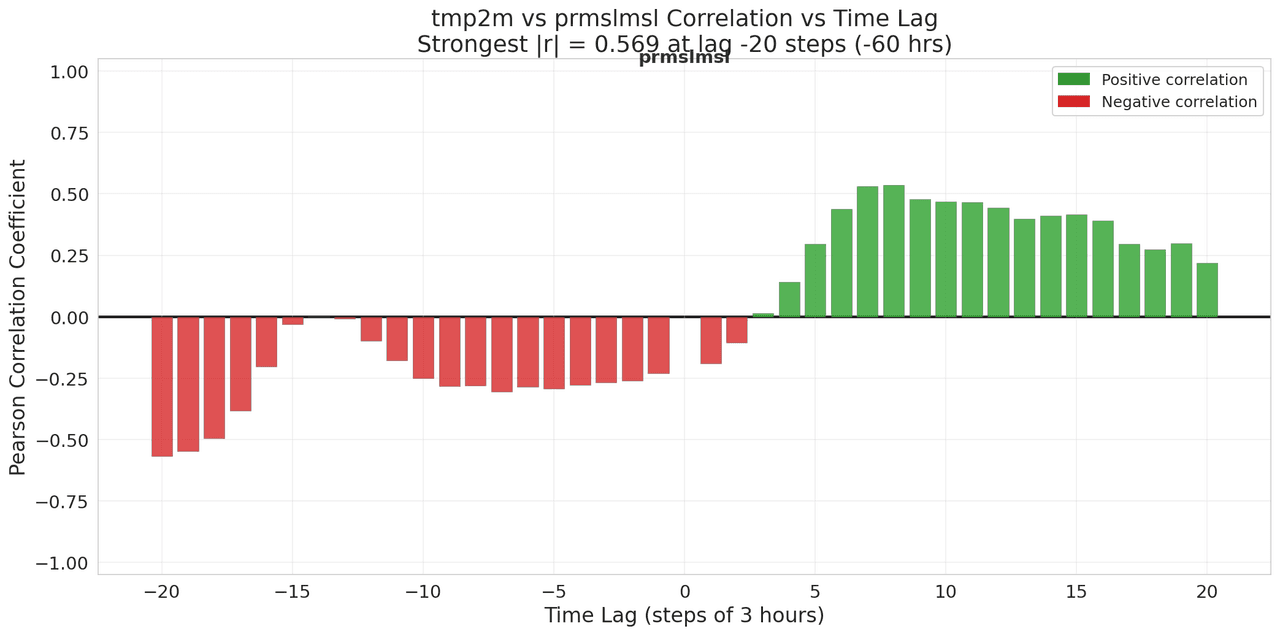
Lagged Correlation Analysis
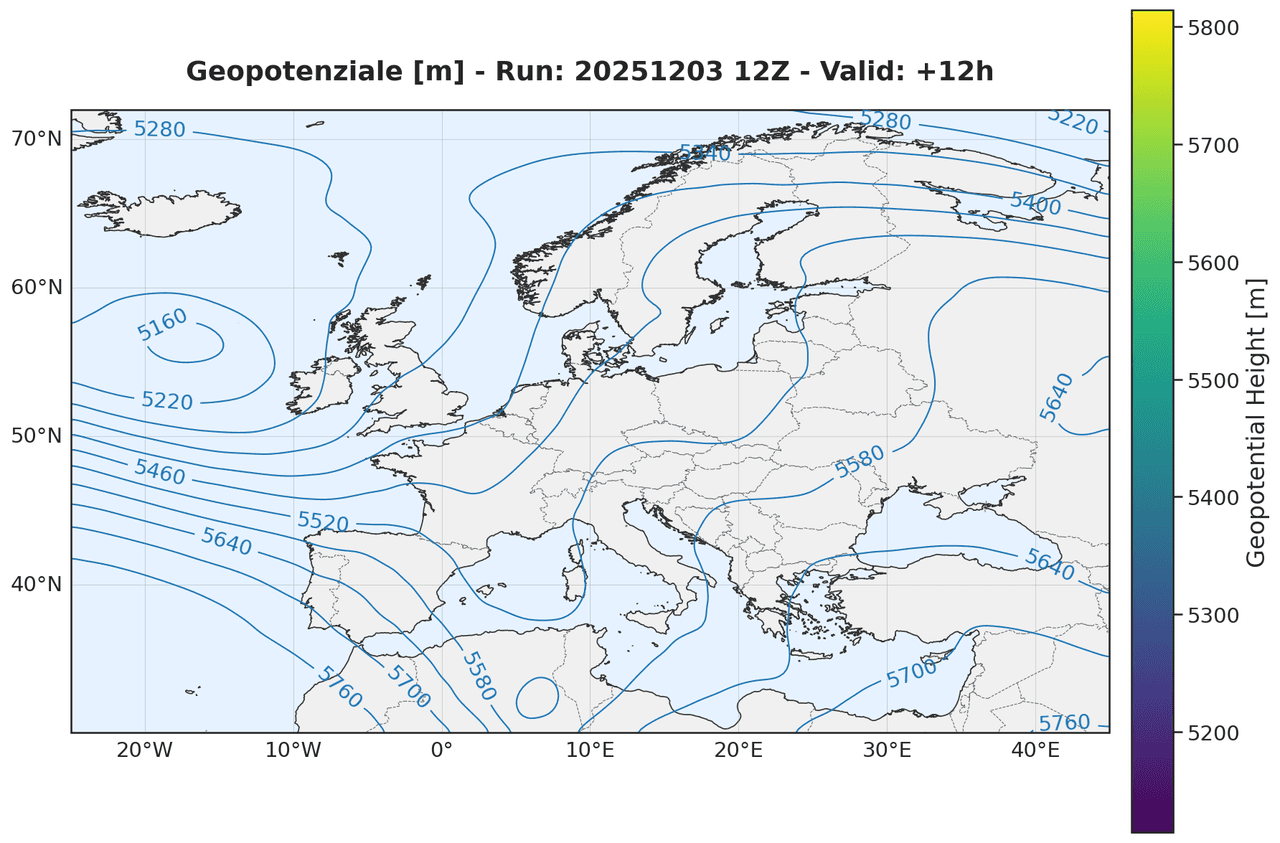
Geopotential height at the 500 hPa pressure level