Menu
Refer a Friend
Share your link — earn +15 permanent plots for every friend who joins.
Sign in to get your referral linkMap of mean sea level (MSL) pressure
Description
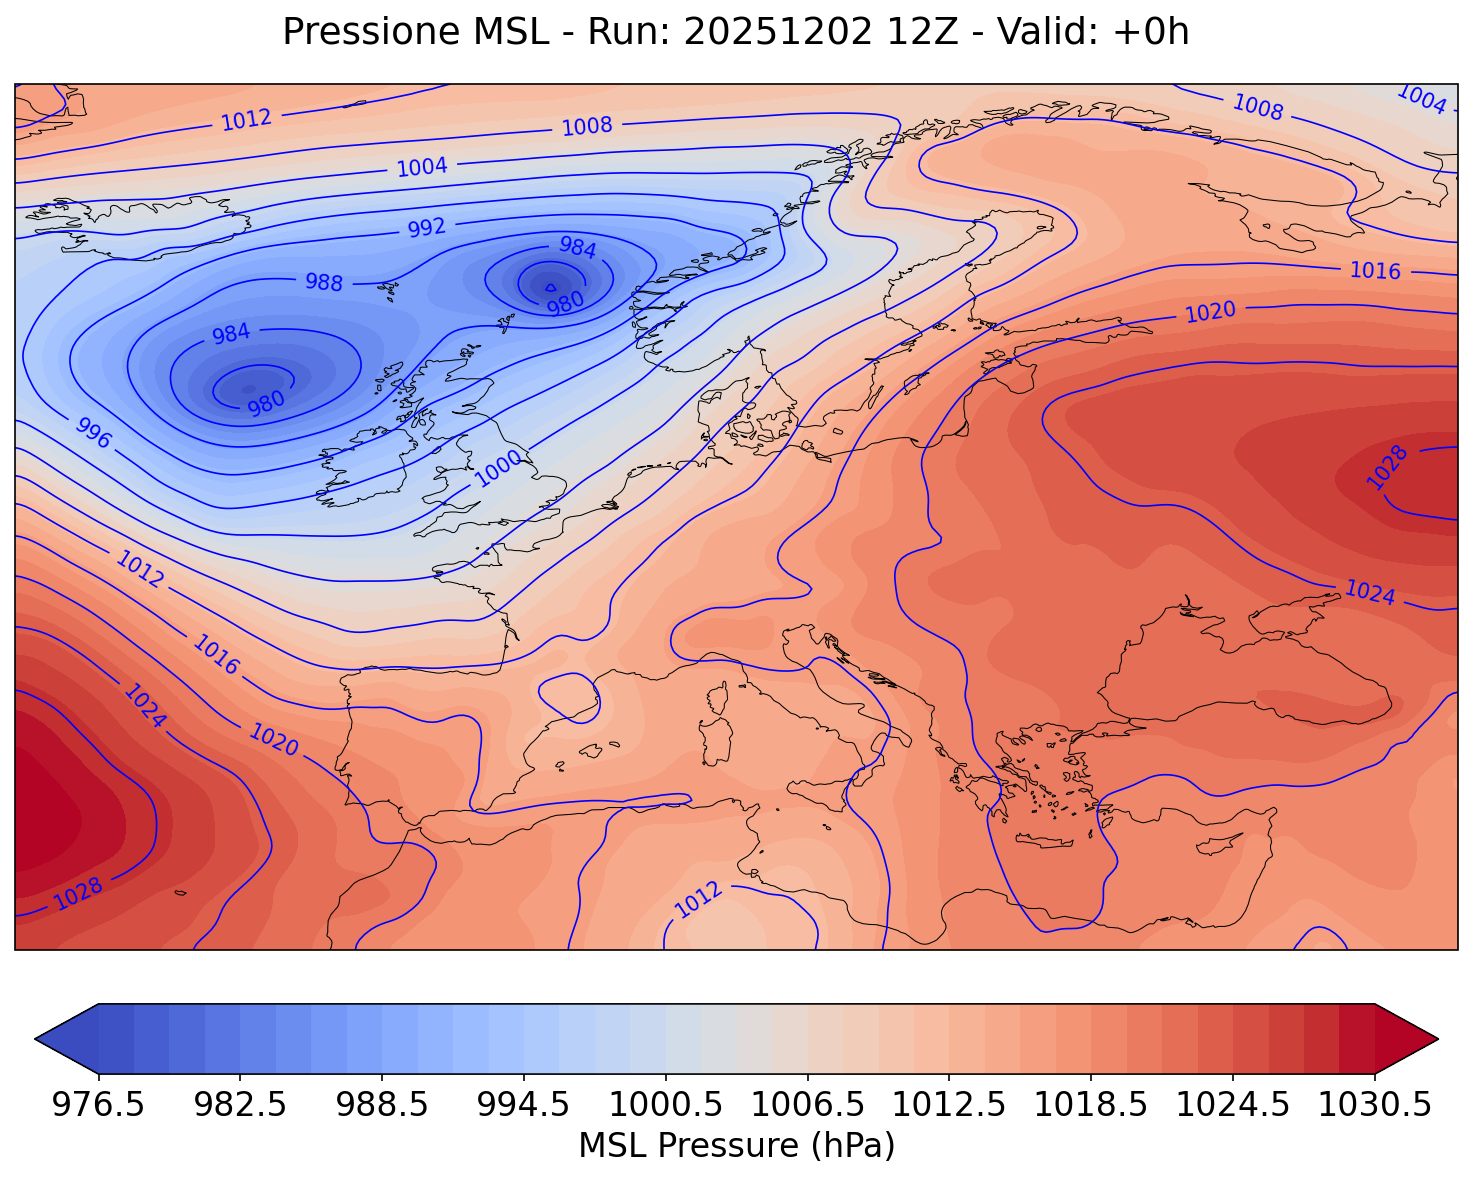
The visualization presents a geospatial map of mean sea level (MSL) pressure across the North Atlantic and European region, spanning longitudes from -25°E to 45°E and latitudes from 30°N to 72°N. The data, derived from a numerical weather prediction model run initialized at 12Z on December 2, 2025, and valid for +0 hours, is displayed using filled contours with a 'coolwarm' colormap, where cooler (blue) tones represent lower pressures and warmer (red) tones indicate higher pressures. Black isolines are overlaid at 4 hPa intervals, with labels for clarity. Gaussian smoothing (σ = 1.5 grid points) is applied to reduce noise and enhance pattern visibility. The plot reveals a typical mid-latitude pressure distribution, with a prominent subtropical high-pressure system evident in the southwestern portion of the domain (around 30°N, -25°W), characterized by pressures exceeding 1026 hPa. Pressure gradients suggest a ridge extending northeastward, potentially influencing weather patterns such as clear skies under the high and possible cyclonic activity to the north. This configuration is significant for understanding synoptic-scale atmospheric circulation, forecasting weather events like storms or stable conditions, and validating model performance against observations.
Tags
Creator
57343531-6c88-468e-a41a-a14a875e3f74
Published
December 3, 2025
More sharing options
More like this
Similar plots from the gallery.
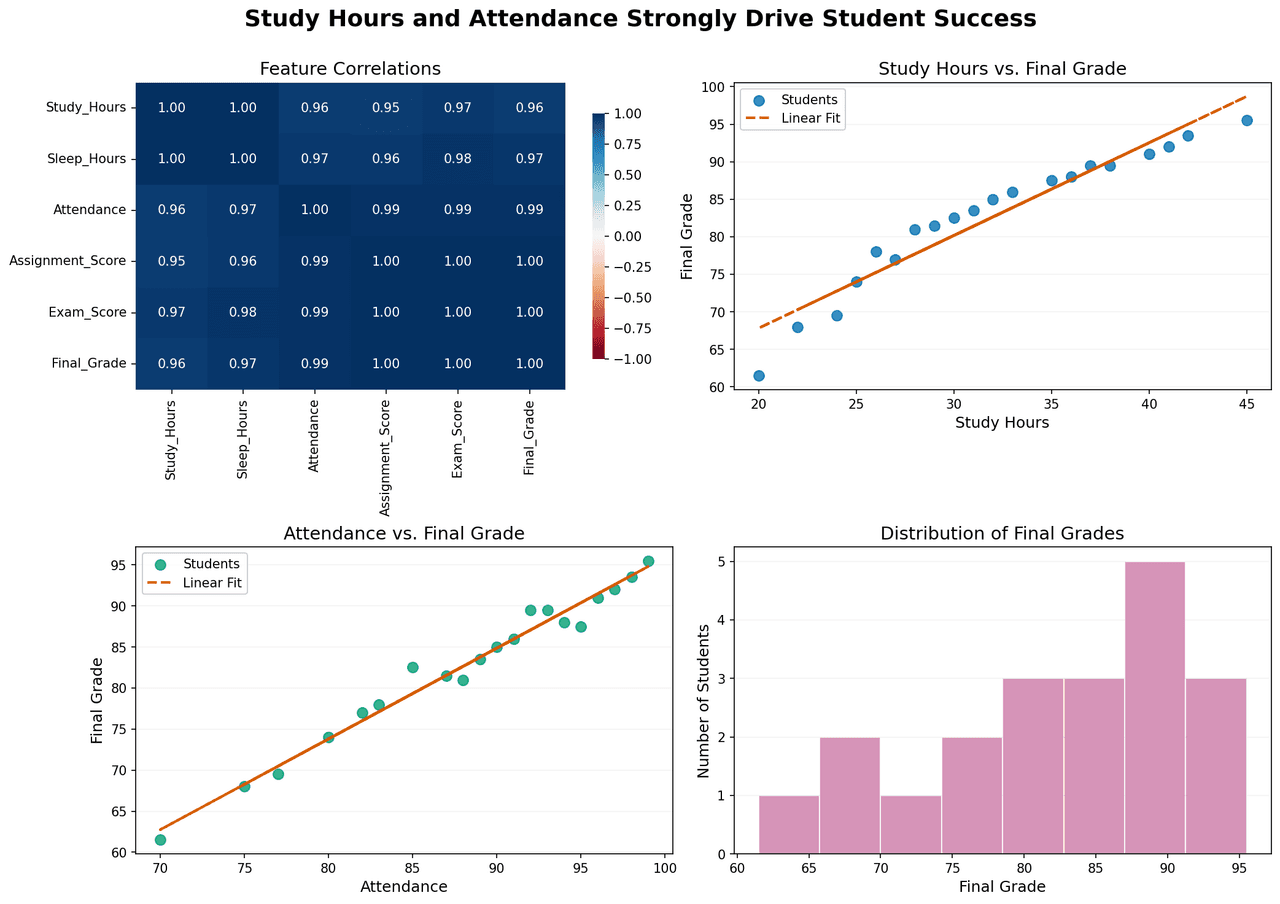
Correlation analysis and performance distribution of student success metrics.
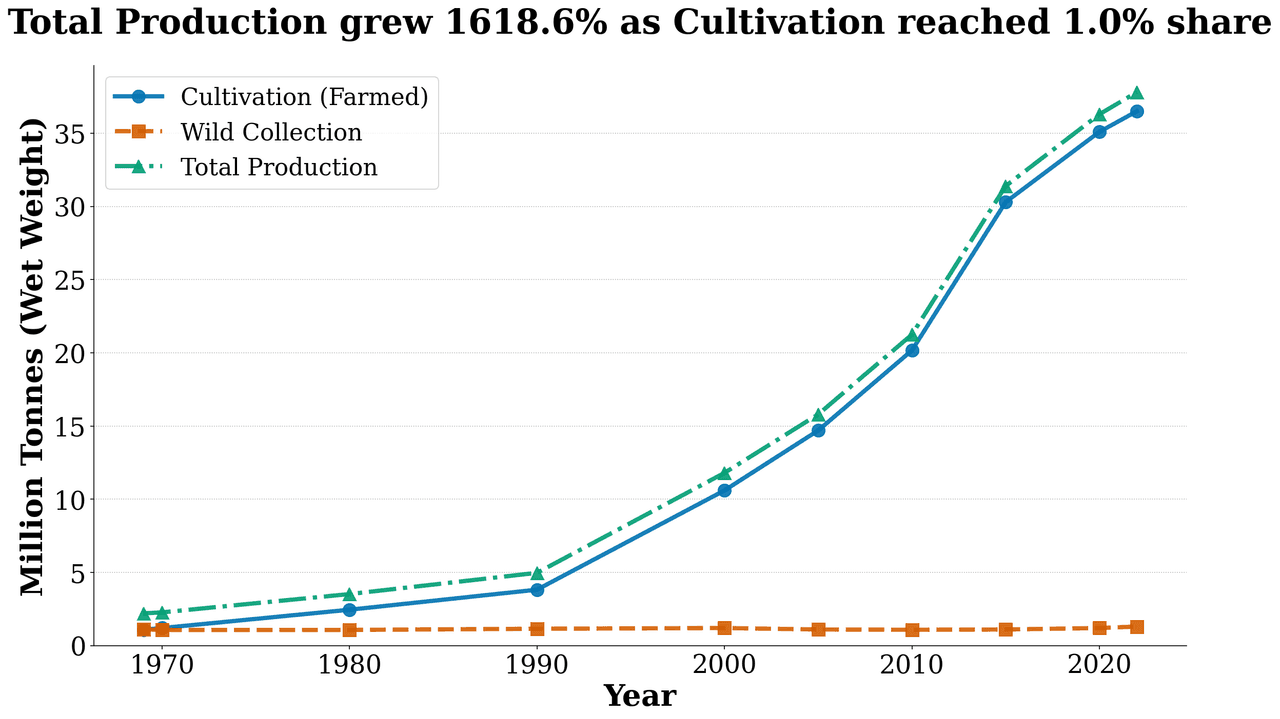
Production Trend
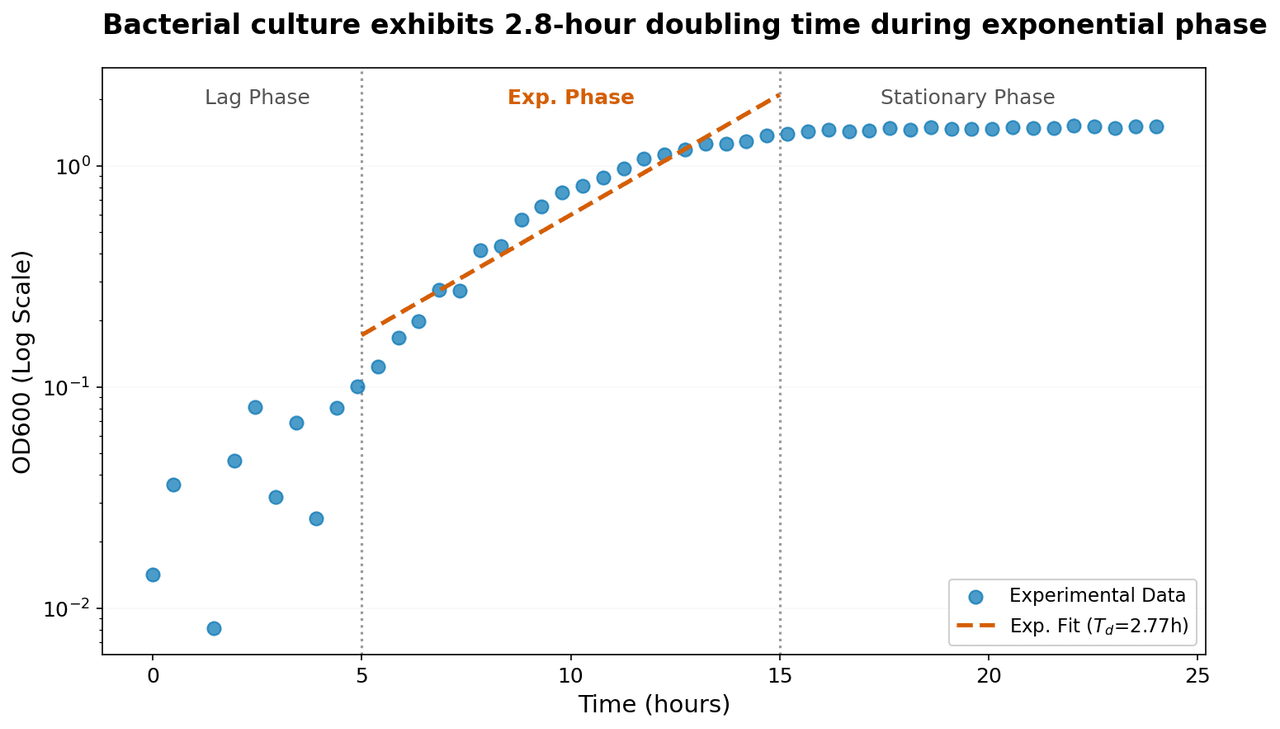
Semi-logarithmic plot of bacterial growth showing optical density (OD600) as a function of time.
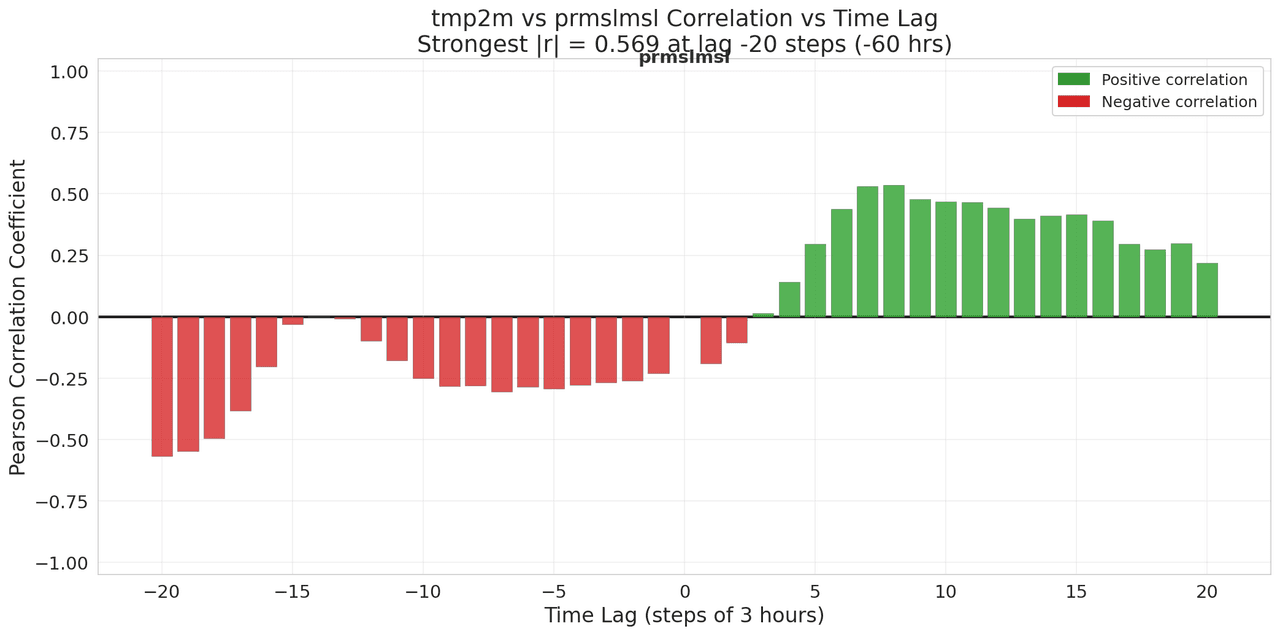
Lagged Correlation Analysis
![PWAT (pwatclm) and Td (dpt2m) time series data (10 three-hourly observations) normalized via min-max scaling to [0,1] independently.](/_next/image?url=https%3A%2F%2Fmznathvfriiouibqrfyh.supabase.co%2Fstorage%2Fv1%2Fobject%2Fpublic%2Fgallery-images%2Fvik.ariel-bc5231dabc%2F20251208182006-3b8626a3dd88.png&w=1280&q=70)
PWAT (pwatclm) and Td (dpt2m) time series data (10 three-hourly observations) normalized via min-max scaling to [0,1] independently.