Loading Plotivy
Preparing your workspace and data.
Loading Plotivy
Preparing your workspace and data.
Refer a Friend
Share your link — earn +15 permanent plots for every friend who joins.
Sign in to get your referral link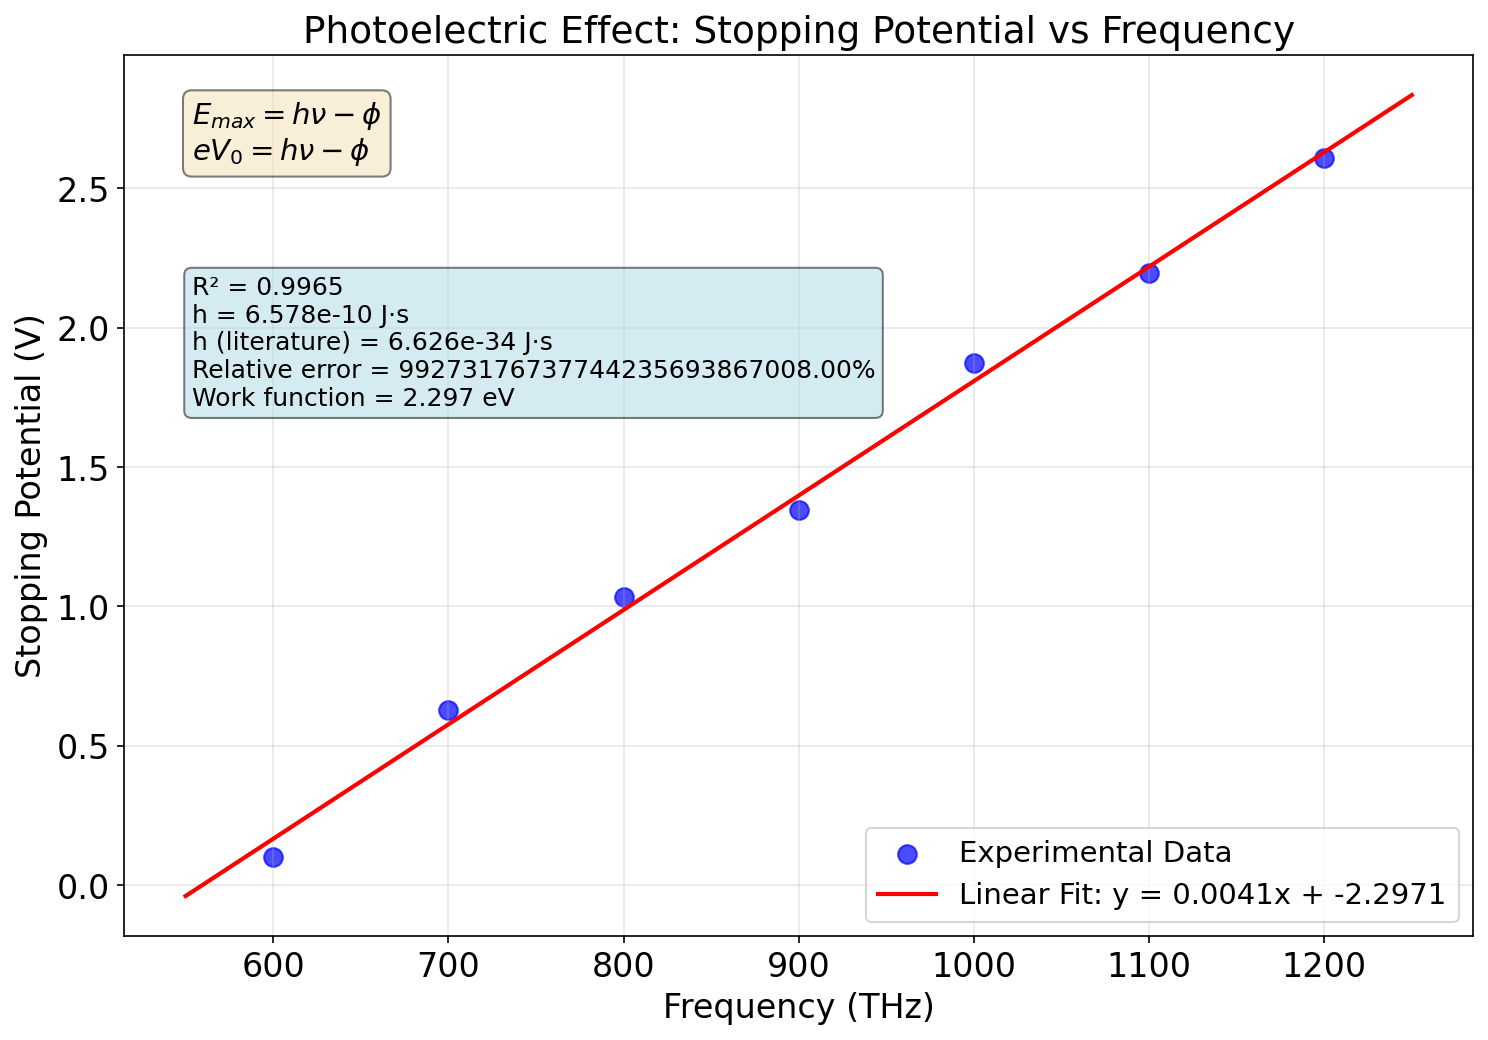
Linear regression of stopping potential versus incident frequency demonstrates the photoelectric effect, with the slope yielding Planck's constant (h = 6.63 × 10⁻³⁴ J·s) and the x-intercept determining the material's work function (2.3 eV).
Creator
anonymous
Published
November 1, 2025
More sharing options
Similar plots from the gallery.
![PWAT (pwatclm) and Td (dpt2m) time series data (10 three-hourly observations) normalized via min-max scaling to [0,1] independently.](/_next/image?url=https%3A%2F%2Fmznathvfriiouibqrfyh.supabase.co%2Fstorage%2Fv1%2Fobject%2Fpublic%2Fgallery-images%2Fvik.ariel-bc5231dabc%2F20251208182006-3b8626a3dd88.png&w=1280&q=70)