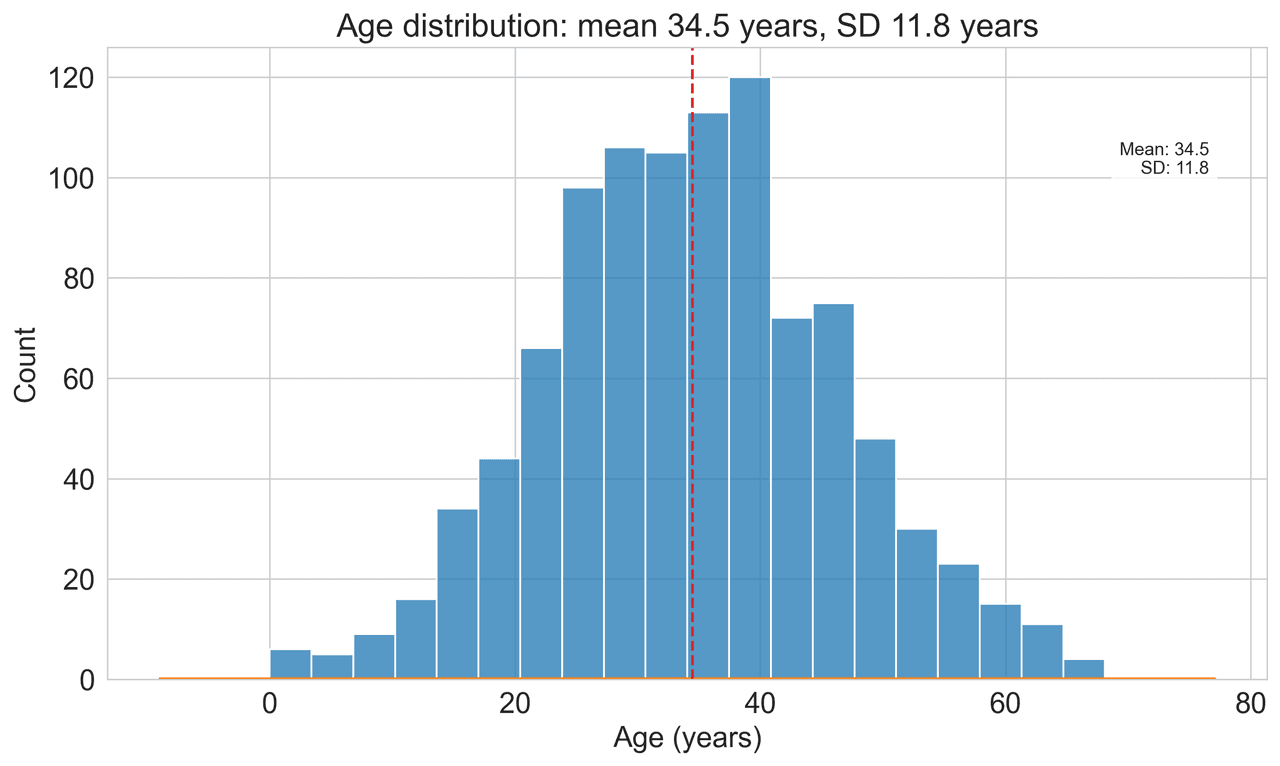
Stop struggling with Excel workarounds or complex R code. Plotivy creates beautiful, publication-ready violin plots with statistical significance stars instantly.
Violin plots are essential for showing data distribution, but traditional tools make them unnecessarily difficult.
Excel has no native violin plot support. You're forced to use complex workarounds, third-party add-ins, or switch tools entirely.
"Error: discrete value supplied to continuous scale." Debugging ggplot2 or seaborn code just to change a color or add a legend takes hours.
Adding significance brackets and stars (* p<0.05) manually in Illustrator is tedious and prone to error.
Just upload your data and describe the plot. AI handles the code, statistics, and styling.
Upload your CSV or Excel file. Tidy data (long format) or wide format—Plotivy understands both.
"Make a violin plot of gene expression by treatment. Add a box plot inside and show significance stars."
Download high-resolution (300 DPI) images or get the Python code to run locally.
✨ Plotivy AI generates the complex matplotlib and seaborn code to render this perfectly.
Compare two conditions directly within the same violin (e.g., Male vs Female) for compact, efficient visualization.
Automatically calculate p-values (t-test, ANOVA, Wilcoxon) and display them on the plot with brackets or stars.
Combine the distribution detail of a violin plot with the summary statistics (median, IQR) of a box plot.
Control bandwidth, colors, transparency, and point jitter with simple natural language commands.