What is a Violin Plot and When Should You Use It?

A violin plot shows the full distribution of your data - not just the mean and error bar. It combines a box plot with a kernel density estimate, revealing patterns that summary statistics hide.
Sections
0.Live Code: Anatomy of a Violin Plot
1.What It Shows
2.Violin vs Box Plot vs Bar Chart
3.When to Use (and When Not To)
4.Reading a Violin Plot
0. Live Code: Anatomy of a Violin Plot
Three distribution shapes with every component annotated: KDE density, median, IQR box, bimodality, and skewness. Edit the code to explore how different data shapes look.
1. What a Violin Plot Shows
Shape (KDE)
The probability density of the data. Wider sections = more data at that value.
Box (IQR)
The interquartile range (25th-75th percentile). Shows where the middle 50% of data falls.
Median Line
The middle value. Half the observations are above, half below.
Whiskers
Extend to 1.5x IQR. Points beyond are potential outliers.
Try it
Try it now: compare your groups with the right chart
Generate box, violin, or bar charts directly from your dataset and choose the clearest visual for your paper.
Generate comparison charts →Newsletter
Get a weekly Python plotting tip
One concise tip each week for cleaner, faster scientific figures. Built for researchers who publish.
2. Violin vs Box Plot vs Bar Chart
| Feature | Bar + Error | Box Plot | Violin Plot |
|---|---|---|---|
| Shows distribution shape | No | No | Yes |
| Reveals bimodality | No | No | Yes |
| Shows outliers | No | Yes | Yes (with box) |
| Shows sample size | No | No | Via width scaling |
| Easy to interpret | Very easy | Easy | Medium |
| Min. sample size | Any | 5+ | 20+ |
3. When to Use (and When Not To)
Use Violin Plots When:
Comparing 2-7 groups with 20+ observations each
You suspect bimodal or multimodal distributions
Reviewers request 'show your data' (not just bars)
Distribution shape matters (drug response, gene expression)
Do NOT Use When:
Small sample sizes (n < 10 per group)
Categorical counts or proportions (use bars)
Time series data (use line charts)
More than 8-10 groups (becomes unreadable)
4. How to Read a Violin Plot
Wide section at the middle?
Most of your data clusters around that value. The distribution is unimodal.
Two bulges?
Bimodal distribution. There may be two sub-populations in your data.
Long tail on one side?
Skewed distribution. The mean and median will differ.
Narrow throughout?
Uniform distribution or very small sample size (not enough data for KDE).
One violin much wider than others?
If scale='count', that group has more observations.
Chart gallery
Distribution Chart Types
Compare violin plots with other ways to show distributions.

Violin Plot
Combines box plots with kernel density to show distribution shape across groups.
Sample code / prompt
import matplotlib.pyplot as plt
import seaborn as sns
import pandas as pd
import numpy as np
from scipy.stats import f_oneway

# Generate exam score data for 3 groups
np.random.seed(42)
control = np.random.normal(72, 12, 50)
treatment_a = np.random.normal(78, 10, 50).png&w=1280&q=70)
Box and Whisker Plot
Displays data distribution using quartiles, median, and outliers in a standardized format.
Sample code / prompt
import numpy as np
import pandas as pd
import matplotlib.pyplot as plt
import seaborn as sns
from scipy import stats

# Generate gene expression data for 4 genotypes
np.random.seed(42)
genotypes = ['WT', 'KO1', 'KO2', 'Mutant']
n_per_group = 20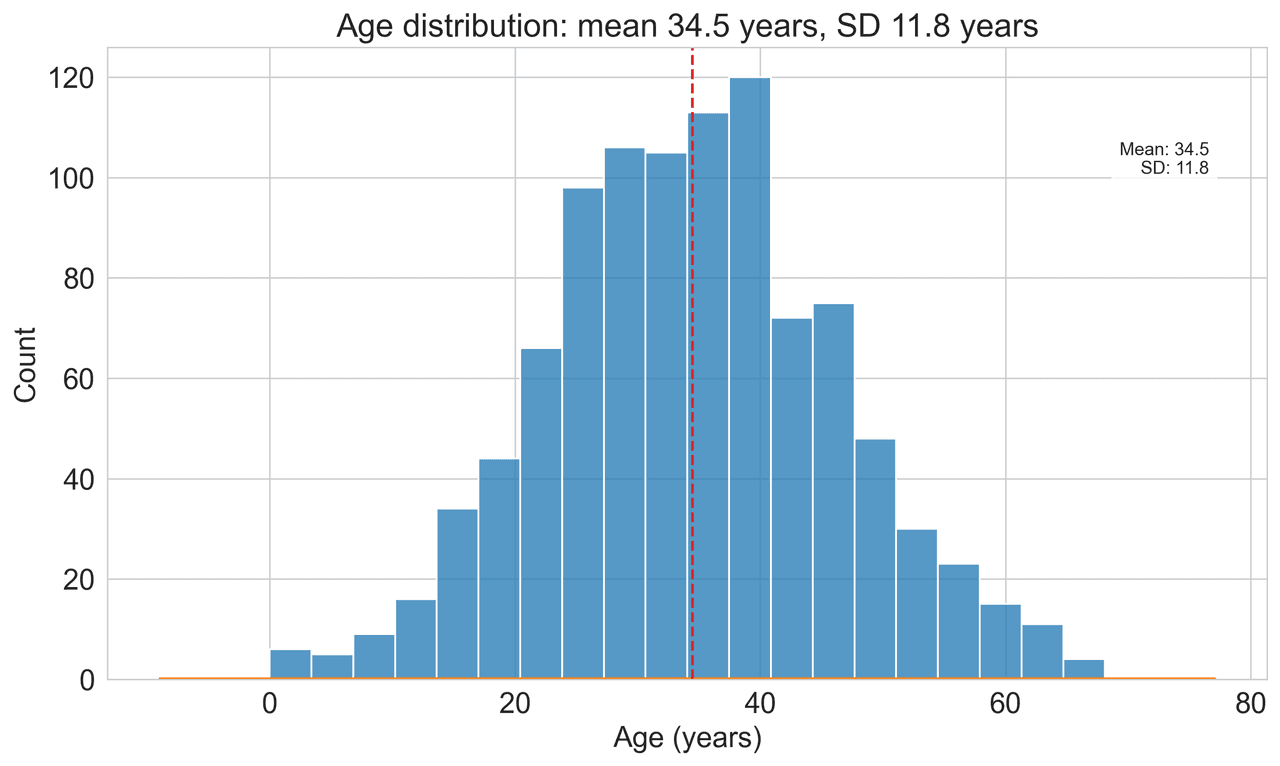
Histogram
Displays the distribution of numerical data by grouping values into bins.
Sample code / prompt
import matplotlib.pyplot as plt
import numpy as np
from scipy.stats import gaussian_kde, skewnorm

# Generate age data with slight right skew
np.random.seed(42)
ages = skewnorm.rvs(a=2, loc=42, scale=15, size=500)
ages = np.clip(ages, 18, 80)  # Clip to realistic range

fig, ax = plt.subplots(figsize=(12, 7))
Bar Chart
Compares categorical data using rectangular bars with heights proportional to values.
Sample code / prompt
import numpy as np
import pandas as pd
import matplotlib.pyplot as plt
import seaborn as sns
from scipy import stats

# Generate performance scores for 5 treatment groups
np.random.seed(42)
groups = ['Control', 'Treatment A', 'Treatment B', 'Treatment C', 'Treatment D']
n_samples = 30
Scatterplot
Displays values for two variables as points on a Cartesian coordinate system.
Sample code / prompt
import matplotlib.pyplot as plt
import numpy as np
from scipy import stats
import pandas as pd

# Generate sample data
np.random.seed(42)
n_samples = 200
height = np.random.normal(170, 8, n_samples)
weight = height * 0.6 + np.random.normal(0, 8, n_samples) - 50
Heatmap
Represents data values as colors in a two-dimensional matrix format.
Sample code / prompt
import matplotlib.pyplot as plt
import seaborn as sns
import pandas as pd
import numpy as np

# Create correlation matrix for financial metrics
metrics = ['Revenue', 'Profit', 'Expenses', 'ROI', 'Customers', 'AOV', 'Marketing', 'Employees']
correlation_data = np.array([
    [1.00, 0.85, -0.45, 0.72, 0.88, 0.65, 0.72, 0.55],
[0.85, 1.00, -0.78, 0.92, 0.75, 0.58, 0.63, 0.48],Create Violin Plots in Seconds
Upload your data and type "violin plot". Plotivy generates publication-ready code instantly.
Related chart guides
Apply this tutorial directly in the chart gallery with ready-to-run prompts and examples.
Technique guides scientists read next
scipy.signal.find_peaks guide
Tune prominence and width parameters for robust peak extraction.
Savitzky-Golay smoothing
Reduce noise while preserving peak shape and position.
PCA visualization workflow
Move from high-dimensional measurements to interpretable components.
ANOVA with post-hoc brackets
Add statistically correct pairwise significance annotations.
Found this helpful? Share it with your network.
Experimental Physicist & Photonics Researcher
Hands-on experience in silicon photonics, semiconductor fabrication (DRIE/ICP-RIE), optical simulation, and data-driven analysis. Built Plotivy to help researchers focus on discoveries instead of data struggles.
More about the authorVisualize your own data
Apply the techniques from this article to your own datasets. Upload CSV, Excel, or paste data directly.